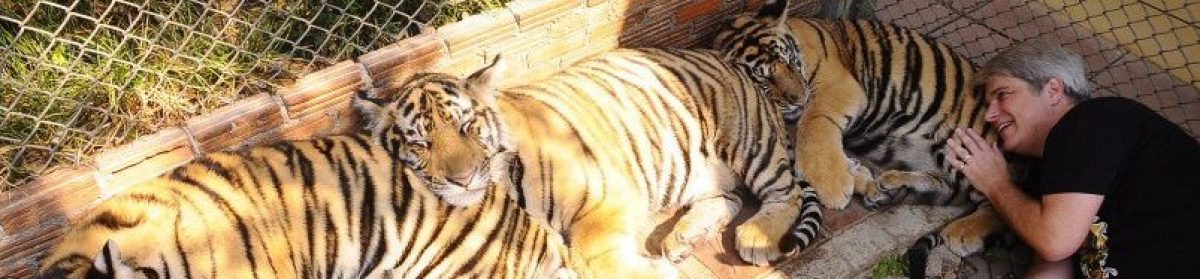
Eurasian Jays like this one are monogamous, and the male gets his mate by offering her food (click for credit).An old proverb says, “The way to a man’s heart is through his stomach.” Some birds, like Eurasian Jays (Garrulus glandarius), have their own take on that proverb. These birds are monogamous,1 and they have an elaborate courtship ritual. Part of that ritual involves the male offering food to the female. For these birds, then, the way to the female’s heart is through her stomach. Obviously, the male wants to offer the female something appealing, but how does he know what she wants?
It has been generally assumed that the male simply offers the female food that he likes. After all, the ability to consider another individual’s feelings is rather advanced. There is some evidence that great apes are able to consider the feelings of human beings,2 but in general, it has been thought that most animals don’t have the intellectual ability to realize that a different individual might have different feelings or preferences. A recent experiment involving Eurasian Jays indicates that might not be correct.
In the experiment, a male was separated from a female by a wire fence. The male could watch the female as she ate large meals of either moth larvae or mealworm larvae. The male was then given a single mealworm larva and a single moth larva. Consistently, the male would pick up the food that was not in the female’s meal and offer it to her through the wire fence. The researchers concluded that this was because the male realized the female would be tired of what she had eaten in her large meal, and therefore the other food would be more appealing to her. This, of course, would mean that the male realized the female might have a different preference than he did, and he took that into account when deciding what to offer her.3
This nematode's nervous system is perfectly wired for minimum use of materials. (click for credit)I have been doing an “interstate book club” with one of the most brilliant people I know. She and I read the same book and call each other on a regular basis to discuss it. We are currently covering Jerry Fodor and Massimo Piatelli-Palmarini’s book, What Darwin Got Wrong. I suspect that I will do a complete review of the book at some point, but I ran across something that I found so amazing, I had to write about it today. It has to do with the roundworm known as Caenorhabditis elegans, which is pictured above. This tiny (about 1 millimeter long), transparent worm has been studied extensively. In fact, it was the first multicellular organism to have its genome fully sequenced.1
Before that happened, however, Christopher Cherniak did a detailed analysis of the creature’s nervous system. Approximately one-third of the cells in the roundworm’s body are nerve cells, so the nervous system is obviously important to this tiny animal. The system is made of clumps of nerve cells (called ganglia) in the head, tail, and scattered throughout the main nerve cord, which runs along the bottom of the worm’s body. While this system is “simple” compared to the kind of nervous systems you find in many other animals, it has served as a model for helping scientists understand how nervous systems develop and function in general.
Of course, since the nervous system has to process sensory information and control various muscle movements, the ganglia must be connected to one another, to the receptors that sense the outside world, and to the muscles that the nervous system controls. Obviously, then, there is a lot of “wiring” involved. Cherniak wanted to know what determined how this wiring was done in the animal, so he computed all the possible ways that the worm’s nervous system could be wired, given its structure and the number of components it had. His computation indicated that there were 39,916,800 ways the wiring could have been done.
Now that’s a lot of possibilities, but even back in 1994, computers could easily analyze all of them, so he used 11 microcomputers to analyze all 39,916,800 ways the nervous system could be wired. It took them a total of 50 hours to churn through the analysis, but what they found was incredible!
A graph showing Global Climate Model predictions compared to surface temperatures (click for credit).The Economist recently ran a story highlighting the fact that the Global Climate Model (GCM) predictions upon which most of the fear of global warming is based are not doing well when compared to measured surface temperatures over the past few years. I found the story to be surprisingly balanced and full of a lot of good thoughts. I strongly recommend that you read it if you can find the time, because it gives you a great idea of how little we know about climate science. I don’t want to rehash the article, but I do want to add some thoughts of my own.
If you look at the graph above (which is from the article), you will see the GCM predictions most recently cited by Global Warming advocates. The dark cyan areas represent what the GCMs predict with a certainty of 75%, and the lighter areas represent what the GCMs predict with a certainty of 95%. As you can see, the measured surface temperatures (given by the dark line) are not behaving as predicted for the past several years. In fact, they have already strayed out of the 75% certain predictions and are poised to stray out of the 95% certain predictions. This, of course, is discussed in the article. What is not discussed is that the graph is rather misleading.
If you look at the graph from 1950 to the present day, you will see remarkable agreement between the GCM “predictions” and the measured data. However, prior to 2001, none of those “predictions” are actual predictions. They are a retrospective fit to the already-known data. You see, the GCMs are so oversimplified that they contain all sorts of “fudge factors.” Those fudge factors are varied to produce as much agreement as possible between the known data and the GCMs. Since the GCM predictions shown in that graph were produced for the IPCC report issued in 2007, they represent work done after the IPCC report issued in 2001. As a result, the data that appear on the graph prior to 2002 were all known when the work was started on the 2007 report. This means that all agreement between the “predictions” and the data prior to 2002 say nothing about the ability of the GCMs. It only tells you how well the fudge factors could be varied to agree with the known data.
This broad-barred goby is one of the species that responds to a coral's call for help (click for credit)
Anyone who has read this blog for a while knows that I am fascinated by the mutualism that seems to be all over creation. You can seem some of my previous posts about this topic here, here, here, here, and here. I recently came across a study that provides another example of mutualism in one of favorite habitats: a coral reef. As an amateur scuba diver, I spend a lot of time enjoying the wonders of coral reefs, and the more we study their biology, the more amazed I am at the interconnectedness that exists among their inhabitants.
The authors of the study were trying to understand how a very common species of coral, Acropora nasuta, protects itself against the toxic seaweed Chlorodesmis fastigiata. This particular seaweed attempts to take over a coral reef by producing chemicals that harm the coral. The chemicals reduce the coral’s ability to grow and feed, allowing the seaweed to “muscle in” on the coral’s turf. When the seaweed is completely successful, it chokes out the coral, forming a shrubby thicket where the coral once was.
As the authors note, previous studies have already shown that overfished coral reefs are more likely to be taken over by such seaweed, so they wondered if perhaps the fish that live in the coral reefs provide some sort of protection for the coral. They found that certain species of goby (particularly the broad-barred goby, Gobiodon histrio, and the redhead goby, Paragobiodon echinocephalus) do, indeed, protect the coral from the seaweed, but the process by which this happens is rather surprising.
A chromosome-by-chromosome comparison of chimpanzee and human DNA. The chimp DNA was cut into slices of varying lengths (see legend on the right), and a similar sequence was searched for on the relevant human chromosome, which is shown on the horizontal axis.
(Copyright Answers in Genesis, published at http://www.answersingenesis.org/articles/arj/v6/n1/human-chimp-chromosome in a study by Jeffrey P. Tomkins)
I have written about the similarity between human and chimpanzee DNA three times before (here, here, and here). It’s an important question for creationists, intelligent design advocates, and evolutionists alike, since the chimpanzee is supposed to be the closest living relative to human beings. As a result, a comparison of chimp DNA to human DNA gives us some idea of what the process of evolution would have to accomplish to turn a single apelike ancestor into two remarkably different species like chimpanzees and people.
Early on, it was widely thought that human DNA and chimp DNA were 99% similar. As I discussed in my first post on this subject, that was based on a very limited analysis of only a minute fraction of human and chimp DNA. Now that the entire set of nuclear DNA (collectively called the “genome”) of both humans and chimpanzees have been sequenced, we now know that the 99% number is just plain wrong. Interestingly enough, however, even though both genomes have been fully sequenced with a reasonable amount of accuracy, no one can agree on exactly how similar the two genomes are.
Why is that? Because comparing genomes is a lot harder than you might think. While we know the sequence of the chimp and human genomes really well, we don’t understand the DNA itself. Indeed, there are large sections of DNA that seem to be functional, but we simply have no idea what they do. As a result, comparing the genomes of two different species can be very, very tricky.
DNA can store incredible amounts of information (montage of public domain images)A few months ago, I wrote an article about a group of scientists who stored a book that contained words, illustrations, and Java script on DNA. It was an amazing technical achievement, and it demonstrated the incredible storage capabilities of this marvelous biomolecule. Well, another team of scientists has gone even further: they stored words, pictures, and audio on DNA!
Yes, the team encoded all 154 of Shakespeare’s sonnets, a photograph of the European Bioinformatics Institute (where the scientists work), and a 26-second audio clip from Martin Luther King’s famous “I have a dream” speech.1 Also, in a very fitting symbolic gesture, they added the famous James Watson and Francis Crick paper that first revealed the structure of DNA.2
This new achievement was noteworthy for more than just the fact that the scientists stored audio on DNA. While the method that the previous team used to store the book worked well, it was difficult for instruments to retrieve the information from the DNA once it was stored there. Thus, the time it took to retrieve the book from DNA storage was fairly long. The scientists who produced this study used a different method to store the information, which made it much easier for instruments to read it back. As a result, not only was everything retrieved from DNA storage with 100% accuracy, the time it took to get it back was significantly reduced.
DNA uses four nucleotide bases taken three at a time to code for an animo acid (click for credit).The genetic code is degenerate, but that doesn’t mean it is immoral or corrupt. In fact, in the case of the genetic code, degeneracy is a good thing! Let me explain. One of DNA’s jobs is to tell the cell what proteins to make and how to make them. As a result, it stores “recipes” for proteins, and we call those recipes genes. Well, a protein is produced when smaller chemicals, called amino acids, are linked together in long chains that then fold into intricate shapes. So in order to tell a cell how to make a protein, a gene needs to list a string of amino acids. If the cell puts those amino acids together in the order specified by the gene, the correct protein can then be produced.
How does a gene list the amino acids? As shown in the illustration above, it does so by using the four nucleotide bases known as cytosine (C), guanine (G), thymine (T), and adenine (A). A group of three nucleotide bases codes for a specific amino acid. For example, when a gene has three thymines in a row (TTT), this means “use the amino acid called lysine.” When it has three guanines in a row (GGG), it means “use the amino acid called proline.” So by grouping its four nucleotide bases three at a time, a gene specifies which amino acid should be used in building a protein.
Here’s the catch: There are only 20 amino acids in the standard proteins of life. As a result, there need to be only 20 codes to specify them. However, there are 64 possible ways you can group four nucleotide bases three at a time. Thus, there are 64 different possibilities for how a gene can specify an amino acid, but there are only 20 amino acids the gene needs to specify. As a result, most amino acids are specified by more than one set of three nucleotide bases. As I said above, a sequence of three thymines (TTT) means “use the amino acid called lysine.” However, two thymines followed by a cytosine (TTC) means the same thing. This is why we say the genetic code is degenerate. It has multiple ways it can specify most amino acids.
Horizontal Gene Transfer (represented by the arrows and paths connecting the different lineages in the drawing) is a convenient way for evolutionists to explain around the fact that the data falsify their predictions. (Click for credit)
When I was a young, impressionable student at university, I was taught as fact that all organisms on this planet could be arranged in a hypothetical “tree of life” that showed how all of them evolved from a single, common ancestor. It didn’t matter that no such tree had actually been constructed. I was told that in time, we would be able to sequence DNA quickly and efficiently, and once that happened, the tree of life would emerge from the data in all its glory. However, once DNA analysis did become reasonably quick and efficient, the tree of life never emerged. Instead, the supposed evolutionary relationships that had been determined from the fossil record were contradicted by those that were determined from the genes. Worse yet, the genetic story of evolution changed depending on which specific genes were studied.
This was especially apparent in the analysis of single-celled organisms. As more and more genetic analyses were done on such organisms, it became increasingly obvious that there was simply no way to arrange their genetic information into any pattern that even remotely resembled a hypothetical tree of life. Some scientists understood what this meant: there is something seriously wrong with the evolutionary framework to which biologists have been clinging. As a result, they have started investigating other, more promising paradigms such as creationism or intelligent design. However, most biologists continue to cling to a view that has been falsified again and again by various data. As a result, they had to find a “way out.” They had to find some means by which they could explain around the fact that the genetic data falsified the tree of life.
Enter the concept of Horizontal Gene Transfer, also known as lateral gene transfer. In this process, a section of DNA is transferred from the genome of one organism to the genome of another, unrelated organism. In other words, rather than passing down a gene through the process of reproduction, horizontal gene transfer allows a gene to travel horizontally between unrelated organisms.
Now the phenomenon itself was known long before the problem with the tree of life had been documented. Way back in 1960, for example, Japanese scientists determined that an antibiotic-resistant bacterium could transfer its resistance to an unrelated bacterium that was not resistant to the antibiotic.1 In time, the mechanism was fully worked out, and it was demonstrated that bacteria could, indeed, swap genes back and forth. As it became increasingly clear that this was a common phenomenon among bacteria, it was recognized that horizontal gene transfer could “smear out” the tree of life for single-celled organisms.2
Since horizontal gene transfer was so successful at explaining away the failed evolutionary prediction of the tree of life when it came to single-celled organisms, it’s not surprising that this same “way out” is now being used to explain why certain genes in animals do not fit the pattern predicted by the evolutionary hypothesis.
The La Brea Tar Pits as imagined by Charles R. Knight (public domain image)
Paleontologists have long recognized that the fossil record produces a serious problem for the hypothesis of evolution. Almost thirty years ago, Dr. David Wake and his colleagues stated:1
With natural selection operating in a changing environment as an agent of adaptation, we expect to see changes at the organismal, ultimately physiological and morphological, level. How, though, can we explain the paradoxical situation in which environments change, even dramatically, but organisms do not?
In other words, evolution predicts that in a changing environment, organisms should change in order to adapt. However, when we look at the fossil record, we don’t see such change. Instead, while it is thought that earth’s climate changed dramatically in many different ways throughout the fossil record, the fossils themselves show that the organisms living on earth didn’t change much at all. This has been called the “paradox of stasis,” and while several attempts have been made to resolve the problem2, none of them have been found to be satisfactory.3
In an attempt to understand the paradox of stasis better, Dr. Donald Prothero undertook a series of amazingly detailed studies. With the help of a small army of students, Prothero studied the fossils of all the common birds and mammals that have been preserved in the La Brea tar pits of Los Angeles, California. According to the standard geological view, these tar pits preserved species that lived in the area over a period of time when the region experienced wild climate change. It is thought that 35,000 years ago, the Los Angeles, California area had a very similar climate to what it has today. During the height of the last ice age (20,000 years ago), however, it was significantly colder and significantly wetter. As the ice age waned, the climate returned to what it was 35,000 years ago.
From an evolutionary point of view, one would expect that over the course of this dramatic change in climate, the birds and mammals living in the area would have experienced some amount of evolutionary change in order to adapt to their surroundings. However, that’s not what this series of studies found.