
NOTE: Based on comments below by Glenn (who is mentioned in the article) and Aceofspades25, there are questions regarding the analysis used in Dr. Tomkins’s study, upon which this article is based. Until Dr. Tomkins addresses these questions, it is best to be skeptical of his 88% similarity figure.
More than two years ago, Dr. Jeffrey P. Tomkins, a former director of the Clemson University Genomics Institute, performed a detailed, chromosome-by-chromosome comparison of human and chimpanzee DNA using a widely-recognized computer program known as BLAST. His analysis indicated that, on average, human and chimpanzee DNA are only about 70% similar. This is far, far, below the 95-99% numbers that are commonly cited by evolutionists, so once I read the study, I wrote a summary of it. Well, Dr. Tomkins has done a new study, and it invalidates the one he did two years ago.
The new study was done because last year, a computer programmer of financial trading algorithms (Glenn Williamson) discovered a bug in the BLAST algorithm that Tomkins used. This bug caused the program to ignore certain matches that should have been identified, which led to an artificially low similarity between the two genomes. As any responsible scientist would do, Dr. Tomkins took this issue seriously and did a detailed analysis of several different versions of the BLAST program. His analysis showed that most of the newer versions of the program were bugged, including the one used in his study two years ago.
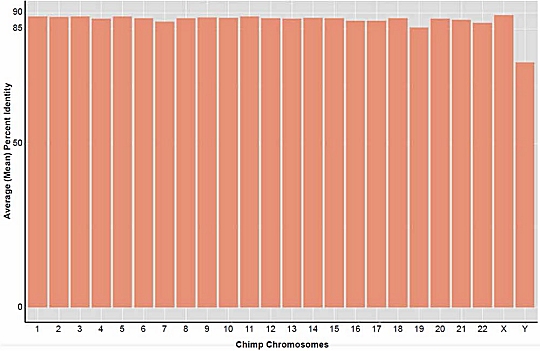
As a result, Dr. Tomkins redid his study, using the one version of BLAST that did not contain the bug. His results are shown above. As you can see, every chromosome in the chimpanzee genome, with the exception of the Y chromosome, matched a corresponding region of the human genome by somewhere between 85% and 90%. The overall similarity between the human and chimpanzee genomes was 88%. While this is still far lower than the 95%, 98%, or 99% similarity touted by many evolutionists, it is much higher than the 70% found in his previous study.
To make sure that these new results aren’t an artifact of some other unknown issue in the BLAST computer program, Dr. Tomkins also did his analysis with two other programs: nucmer and LASTZ. The nucmer program’s results agreed with the unbugged BLAST results: on average the human and chimpanzee genomes are 88% similar. The LASTZ program produced a lower average similarity (73%), which indicates that perhaps LASTZ has a bug or is not optimized for such comparisons, since its results are very close to the results Dr. Tomkins got with the bugged version of BLAST.
I think this is the most comprehensive comparison of human and chimpanzee DNA that has been done, so I am inclined to take the results (88% similarity between human and chimpanzee DNA) as the best number we have to date. Of course, I said something similar about Dr. Tomkins’s previous study (which turned out to be wrong), so take that statement with a grain of salt! [later addition:It might not be the best number we have to date. See note at the top of the article.]
Your last paragraph is indicative of the epistemological limitations of scientific discovery. While empirical testing and observation yield results that give us reasonable certainty about some things, there is a point after which reasonable uncertainty should be recognized. Unfortunately, many scientific endeavors, particularly politicized ones, the certainty of many conclusions can be overrated.
In addition to the shrinking chimp / human DNA “similarity” falls right in line with the ideas of “junk DNA”. This quickly revealed the lack of understanding we still have regarding DNA and not only its function but its purpose as digital information and source code for life. The idea that we understand it and can compare it as “similar” is far from accurate. It is like comparing source code for two different programs and finding similarity– of course there is similar language but the code is different. The similarity in DNA code is only in function and code for things we barely understand such as protein formation, etc. Humans are reported to be 50% similar to banana DNA (in function). The goal of these DNA “similarity” articles (as you well know) are to assert and shape their preexisting evolutionary concepts, therefore, apes must be most similar to humans. We don’t debate that all living things are comprised, coded, and created similarly. It is the DNA software (the information) that is completely different on each species (family or kind or plant, etc.). Thanks for your blog, I enjoy reading it. I think you stay a bit too neutral but still appreciate your quick to the heart of the matter points…
Thanks!
I’m glad he was willing to redo his analysis. It still uses some different assumptions and definitions but I don’t doubt the actual values now. However, I am still mystified why Tompkins will not perform additional analysis to give his number any context. The 88% similarity number doesn’t mean anything without anything to compare it to. Ats apple to oranges to compare to how the 98% number is derived. There is a much more complete Neanderthal sequence available and there are many human genomes available. What is the difference between two human genomes? He could answer that question and then his data would have more weight. I’ve been told by those that have attempted to use his same methodology that two human genomes are only 93-95% similar using his methodology. Maybe that is why he doesn’t want to do the comparison. Joel
I have no idea why his methodology would produce only 93-95% similarity between two human genomes, Joel. That’s definitely not the way BLAST or nucmer should behave under the scenarios he has run. Is there some reason you think otherwise?
When one considers all the caveats Tomkins gives at the end of his paper and especially the large differences in Y chromosomes among males it would not be surprising. We differ quite a bit in our repeat regions and his methodology picks up on that. This is why he must apply his methods in other pairwise comparisons for the values to have any meaning. Tomkins paper is full of lots of nice graphics and lots of great sounding terminology but he doesn’t even address all of the points raised by the manuscript that brought the problems to his attention. It gives the appearance that he doesn’t care about doing something that makes sense to molecular biologists but is just doing it to get a number that will make a good soundbite.
I strongly disagree, Joel. If he was just looking for a good soundbite, he would not have done the reanalysis, as his previous result is a much better soundbite for creationists. Since he is looking at a truly genome-wide comparisons, it is important to include the repeat regions, as they are part of the genome. My impression is that he is trying to give an honest, complete comparison between the genomes, which has not been done by anyone else, at least not to my knowledge.
@DrWile: I think Joel has hit the nail on the head:
he doesn’t care about doing something that makes sense to molecular biologists but is just doing it to get a number that will make a good soundbite
I believe Tomkins only did his reanalysis because I submitted my paper to ARJ, and that painted them into a corner somewhat. They could have rejected my paper for no reason (which they ending up doing anyway, mind you) and pretend that it goes away, and it would look like an obvious cover up. That would destroy the credibility of both Andrew Snelling (AiG/ARJ) and Jeff Tomkins. So they had to do something.
Yay for Tomkins actually abandoning his 70% figure, but he is well aware that his 88% figure is also wrong for the reasons I gave in my paper. I also love how he is disparaging of his method of sequence slicing in his new paper. “This was a great method in my old paper, but now it must be a crap method because it doesn’t give me the result I wanted”.
Not surprisingly, Joel, your speculations are completely wrong. I contacted Dr. Tomkins and asked specifically about such comparisons. Here is his reply:
@DrWile – if you’re in contact with Dr Tomkins, please ask him for the reason why my paper was rejected for publication.
He doesn’t seem overly keen to respond to my emails, and the editor of ARJ has refused to give any reasons. I quote:
“I was courteous enough to send you his paper. I am under NO obligation to answer any or all of your questions.”
I wonder why that is 😀
Linked below is someone saying he was unable to reproduce a similarity number as low as what Jeff Tomkins calculated, and is only able to get something in the ballpark of 88% if the -ungapped flag is passed to BLAST, which causes everything after an insertion to be ignored.
As I understand, if you have something like these sequences:
ATA ATA GCG GCG GCG GCG GCG GCG GCG
ATA ATA TTT GCG GCG GCG GCG GCG GCG GCG
Then BLAST would normally return 90% similarity, but ungapped would return 20% similarity, counting everything after the TTT as different. Or perhaps you need a larger insertion to throw it off? I’m not familiar with BLAST myself and am just going by what this person says.
https://www.reddit.com/r/junkscience/comments/3ofwf8/human_chimp_similarity_take_2/
Do you know anything more about this Dr. Wile?
I don’t know anything more than anyone else reading the paper, Joe. He says:
So he did use the ungapped option when comparing versions, because that was the only way all the versions would run. I don’t know whether or not he used it in the comparison between the two genomes. However, either he didn’t or I seriously doubt that it works the way this person describes, for two reasons:
1) He validated the comparison making his own mutated version of human DNA:
If he used the ungapped flag, and it really does what this person claims, I don’t see how that validation would have worked.
2) The nucmer results were the same, but it uses a different alignment method. It requires no slicing at all. I don’t see how it would return consistent results if the BLAST comparison had the problem this person claims.
I contacted Dr. Tomkins and asked about this. He says:
Since nucmer allows for extensive gapping, and it returned essentially the same number as the BLASTN ungapped analysis, it seems that running BLASTN ungapped on small sequence slices doesn’t strongly affect the results.
Joe, that’s not quite correct.
Take this as a better example
What the -ungapped parameter would do is produce two results for this alignment:
The first result matches 136 / 300 bases (45% of the sequence) and is 134/136 = 98.5% identical and so overall it is a 44% match.
The second result matches 248 / 300 bases (49% of the sequence) and is 100% identical and so overall it is a 49% match.
The best result BLASTN -ungapped will then return for this sequence will be 49%.
I’ve been speaking to the guy who wrote a paper about this issue (which ARJ refused to publish) and he tells me that he’s explained this to Thompkins at least twice.
Regardless, it appears Thompkins has ignored him and chosen to use -ungapped anyway. Not only that but he has completely neglected to mention the obvious ways it would distort his results.
My communication with this person is here and here
Tomkins claims that his small sequence slicing mitigates this. In addition, if the ungapped switch is causing such a problem in his analysis, why does nucmer give the same result, when it does gapping?
I am unable to look into his nucmer results or methodology but he is probably applying some similar error in logic or methodology.
I can say with confidence this because using a blat search for 100 sequences (300bp each) picked randomly from across chromosome 1 has shown that these sequences were on average 98.5% divergent. You can download my SI here.
I’m not the only one who gets results like this. See this diagram for example (paper).
If Jeffrey believes in his results, all he needs to do is publish his data. He should show us a lot of his sample sequences and prove that they really are as different as he claims.
@DrWile – ungapped behaviour is most certainly not mitigated by small sequence slices.
As I’ve said many times, if there is a single base pair indel in the middle of a 300bp sequence, Tomkins will say this is a 50% match.
Tomkins is most certainly aware of this, yet he chose to publish it. I think that says pretty much everything.
@JoeCoder
I think you’ve chosen an unfortunate pair of sequences in your example here, which doesn’t really demonstrate the difference in behaviour.
It’s unfortunate because what follow the “TTT” is a repeated “GCG”, so what an ungapped BLAST would do in this case is treat the “TTT” as three mutations, not as a 3bp indel, because it can align the rest of the repeated “GCG”s. An ungapped BLAST in this case would return 90%.
If the sequence AFTER the “TTT” was more unique, then it would figure out that the “TTT” was an indel, and not three mutations. Even so, it would report a 70% identity, because the alignment on the right hand side is larger than the alignment on the left.
The other obvious thing that Thompkins hasn’t dealt with in his BLASTN analysis, I talk about here.
There are a few cases where no match will be found because this entire sequence appears de-novo in Chimpanzees as the result of a single mutation (e.g. a novel transposable element – see here) or because humans have had a large deletion which other primates don’t. Deletions like this also likely occurred in a single mutation – see here
Thompkins would count both of these as being a 0% match (or 600 effective mutations if the sequences he was searching for were 300bp each). In reality, these probably represent just 2 mutations.
Hi,
Thanks Ace, for letting me know about this post. I reiterate here a few things about my (unpublished!) paper, and about Tomkins’ new paper.
The first thing is that he uses the “ungapped” parameter in his BLAST comparisons. As I’ve written in a few other places now, using this parameter, and calculating results in the way that Tomkins does is entirely disingenuous. If you are comparing two 300bp sequences, and one of those sequences has a single indel smack bang in the middle, Tomkins counts this as the sequences being only 50% identical.
I’ve told him at least twice that he cannot use ungapped and then calculate the result in this way. He can do one of two things:
1. Use ungapped, which ignores indels and therefore he can only report the substitution rate. If he did this, he would get a result of around 98.8%.
2. Allow gaps, and – this is what he fails to mention in his paper – get a result of around 96.9%. And this is using a very conservative method of calculation as well, since it counts a 50bp indel as having the same weight as 50 individual mutations. If you counted a 50bp indel as a single event (which it probably was), then the overall result would be pushed up towards 98%, which is the figure usually thrown around anyway.
As for nucmer getting 88% as well, I can only say right now that I am completely unfamiliar with nucmer, but I’ll be looking at it in the future. I am quite concerned though that Tomkins required a monster computer to calculate this 88% (384Gb of RAM?!?!), and I don’t have anywhere near the computing resources available to me (8Gb of RAM on my Mac Mini 😀 ).
@Dr Wile: I think you should re-read Tomkins explanation of why he did not use ungapped. It was purely for pragmatic reasons, complete disregard for what the parameter does to his results.
If he used the ungapped flag, and it really does what this person claims, I don’t see how that validation would have worked.
AceOfSpades has already linked to my comment on another blog that gave an actual demonstration of gapped vs ungapped behaviour. Why Tomkins validation worked is simply because he tested only 10 sequences, while the bug manifested in BLAST is a function of the number of queries that are submitted in “batch mode”. If you have this in mind when you look at Tomkins original results in 2013, you can see that for the bigger chromosomes, the “optimal” result that he achieved was with a longer sequence slice (e.g. 500bp). This is because a bigger sequence slice meant less sequences. There is a whole lot more to say about this, but I think it wrote it well in my paper:
https://www.dropbox.com/sh/dm2lgg0l93sjayv/AACQasd3Z0zLvGn8HTOPM8uQa/Tomkins-BLAST.pdf?dl=0
Look for the part that shows that it was mathematically impossible to get some of the results he did, and this should have tipped him off as to the existence of a bug.
That will do for now, it’s time for brekkie.
Thanks for your comments. Based on what you and Aceofspades25 have written, there is reason to doubt his 88% number. I have added notes to the article to point this out.
Thanks for the note. There is no doubt these calculations are complicated and full of assumptions for all parties who attempt to calculate the similarity of two pieces of code. Personally the percentage doesn’t tell me a whole lot by itself whether 88 or 98. I would hope that Christians wouldn’t gain or lose strength in their conviction that Man is a special creation based on the similarity or dissimilarity of our physical coding. We are far more than our code.
That is one point upon which you and I totally agree, Joel.
I must say, I’m a bit skeptical of the notion that his Perl script somehow validates the accuracy of his algorithms. If you know how your algorithm is grading similarity, then obviously the “random mutation” script is going to match, and putting in 74% on the back end will give you 74% on the front end.
The claim that small sequence slicing mitigates the problems with the ungapped parameter seems like wishful thinking. Smaller slices have a better chance of avoiding a gap or insertion mutation, but they’re also more sensitive to the gaps or insertions they do contain, so I can’t really see (at least not without a full publication of his data) how that’s supposed to help him at all.
And of course all this is moot, because Thompkins isn’t actually willing to use this method in the way it should be used if he wants to validate the creationist model. Coming up with a smaller “match percentage” number is great propaganda, but shoddy science. If he really wanted to put his model to the test, he’d do an equal, blinded cross-comparison between dozens of genomes at once: human vs chimpanzee, chimpanzee vs gorilla, tiger vs ocelot, mastodon vs Asiatic elephant, great panda vs cave bear, dingo vs poodle, and so forth. That’s what would make his numbers meaningful. Otherwise they’re utterly useless.
You are going a bit far to claim that his numbers are “utterly useless” unless put in the context that you would like to see, David. In fact, an accurate number for the similarity of the human/chimp genomes by itself would be useful, because if nothing else, it would indicate the amount of genetic change that would need to happen in the supposed evolution of chimps and humans from their common ancestor. That, in turn, could tell us something about the possibility of it happening over the hypothetical time period over which the hypothetical divergence took place.
A comparison of other pairwise similarities certainly isn’t the only way that percent similarity can be placed into a useful context, though as I said it’s most likely the only way he could actually put his model to the test.
There are other ways that a percent similarity value can be given context…most commonly, through some agreed-upon or understood standard for how similarity is measured. But a naked number isn’t useful because its meaning is undefined. If you have a 100 bp sequence with a single 6 bp frameshift of a 10 bp subsection, is that 94% similarity, 90% similarity, or 84% similarity? All three values CAN be useful, but only when we know how similarity is being “counted”. Otherwise the values are arbitrary.
An accurate number for the similarity of the human/chimp genomes would be quite useful as long as we knew how it was being measured and what it represented. But a naked number figure is just a soundbyte, nothing more.
Perhaps you should read the paper, David, because he explains exactly how he calculated the differences, what they represent, and he does this chromosome-by-chromosome. Thus, this isn’t some “naked number.” It is his attempt to determine exactly how different the genomes are on a chromsome-by-chromosome basis. Thus, if it is correct, it is a very useful number.
Explaining how differences are calculated and what they represent is indeed the whole point. Similarity isn’t an abstract quality; it’s the result of applying a certain statistical method. As long as the statistical method is known and accepted, then the figure can be quite useful.
I am glad that you now understand that a study like the one done by Tomkins can be useful, if it is correct.
I just heard about this blog and lord bless on its influence, encouragement, and enjoyment.
Troubles but at least iot shows great scholarly interest in obscure subjects within the origin contentions.
This YEC has , for a long time, welcomed 99% dna likeness with primates.
I rralized we do have the same body as apes period. This being unique in nature for two different types of being. Therefore it demans that since we were made in Gods image and God can not have a body within the biological spectrum then neither can we. Not a body representing who we are in identity. YET we must live in the biological spectrum and so the only answer is to give us another creatures body type and the best one is the ape one for fun and profit.
Our ape likeness, to a creationist, is the evidence of our uniqueness. Our kind looks like another kind/ No one else like that.
We don’t have our own body type. Our soul has nothing in common with biology. It could only be we must rent another body type to make the point we are special.
In fact the only reason we are not 100% alike in dna is because of our head size, females being changed to have birthing pains, and post flood adaptations that changed human looks. and less hair and better looking. Adam/Eve were probably the closest dna match with apes then any other people in history.
Reading through the comments about indels It seems that it is assumed that these are due to mutations. But what if they are actually an intrinsic feature, then “correcting” for them will artificially increase the similarity.
I don’t think it matters whether or not an indel is a mutation or an intrinsic feature, at least not when in comes to comparing genomes. If one organism has this stretch of DNA:
AACCGGAACC
and another organism has:
AACCTGGAAC
The “T” would be considered an insertion, but whether or not that insertion is intrinsic or a mutation, I would still say that the sequences are 90% similar, because the only difference is a single nucleotide base out of 10: the “T.”
Particularly in that case I would disagree because DNA is read in 3 letter codons. So we would be comparing
AAC CGG AAC Cxx to
AAC CTG GAA Cxx
in which case we would have ~50% similarity at best.
In such a case a single letter indel would change all the words that follow and probably produce genetic nonsense that would cripple the gene.
I would agree that the proteins produced by the DNA would be significantly different, but that’s not what is being compared. When analyzing genomes, nucleotide bases are compared, and from that standpoint, the similarity is 90%, regardless of what role the “T” plays.
I found the following data;
Human, Base Pairs 3,545,835,014, Genome Reference Consortium Human Build 38, Jun 2015 last update. http://asia.ensembl.org/Homo_sapiens/Info/Annotation
Chimpanzee, Base Pairs 2,995,917,117, Washington University Genome Center, Nov 2012 last update. http://asia.ensembl.org/Pan_troglodytes/Info/Annotation
2.996/3.546=0.844, hence the genomes can’t be more than 84.4% similar.
Am I missing something?
As I understand it, the “Golden Path Length” is the best reference to use, as it is an attempt to build the actual genome. Using those numbers, humans have 3.096 billion base pairs, and chimps have 3.310 billion base pairs. From a length standpoint, then, they are 93.53% similar.
After checking a few references on line, including http://sandwalk.blogspot.com.au/2012/02/how-much-of-our-genome-is-sequenced.html, it appears the “total base pairs” is a better estimate of size than “golden path length”.
Hopefully they are better estimates than several years ago when I saw reports that the chimp genome was larger than the human.
Estimates for both the human and chimp genome sizes could change before the end of the decade.
Actually, the Moran article you linked says he doesn’t know what the golden path length is. Thus, I am not sure how you get that total base pairs is a better estimate. As I understand golden path length, it specifically tries to get rid of redundant regions, producing the more accurate measure of length.
You’re right. I could have used a better reference. How about http://asia.ensembl.org/info/website/glossary.html
Golden path length
The golden path is the length of the reference assembly. It consists of the sum of all top-level sequences in the seq_region table, omitting any redundant regions such as haplotypes and PARs (pseudoautosomal regions).
Base pairs (number of base pairs in the genome)
The base pairs length on pages such as the whole genome display (next to the golden path length) is based on the assembled end position of the last seq_region in each chromosome (from the AGP file), or if there is a terminal gap it is set to the assembled end location of that terminal gap.
So if I understand that correctly the Base Pairs is the better indication of overall size, providing sufficient has been sequenced.
Based on those definitions, Chris, I would still contend that the golden path length is the better indication. Remember, the way they sequence DNA is to cut it up into small sections, sequence the small sections, and then try to put those sections together. In that process, lots of redundant packages get produced. While it is possible those redundant packages are repeated in the genome, it is more probable that they are the same package getting cut over and over again. Getting rid of those redundant regions should, I think, give a better indication of true length.
@Chris:
The first thing you’re missing is the simplistic notion that simply because genomes are different sizes that this limits their genetic identity.
Imagine for a minute that you have two children: Bill and Ted, and Ted has undergone a whole genome duplication – he basically has double the genetic data of his brother Bill. You also have a pet chimpanzee, Jeff, who is 98% genetically identical to Bill.
Would you say that Bill is only 50% identical to Ted? Would you say that Bill is more closely related to Jeff than he is to his brother Ted?
Have you tried doing a chromosome by chromosome breakdown to see why there is supposedly 500Mb of extra DNA? Would love to see you results …
Genome size differences are a poor estimate of identity between species at least in any meaningful way. For example look a these 12 species of Drosophila http://www.genetics.org/content/177/3/1277/T4.expansion.html Species range from 130 to 364 million base pairs in genome size. yet, most creationists would likely consider them all one baramin and thus these genome differences can clearly “evolve”. Likewise individual humans surely differ by several million base pairs in size due to big differences in microsatellite repeats and other mobile genetic elements.
Interesting. Is this due to a loss of genetic information in some strains? This would be quite in line with Creationist expectations.
However you do have a good point that size alone is not necessarily a good means of comparison.
Hard to say if repeat units changes are losses or gains. But lets say that its all loss and the original fruit fly genome were 364 million bp. If there is a fruit fly with 130 million bp and the average person can barely tell the difference and they function nearly the same, this would be a type of confirmation that not all DNA is equally important. If that missing 200mb were truly functional you would think it would make some difference to the organism. No DNA is probably complete junk/useless but its pretty obvious that the majority of DNA has function that is not important enough that it can’t be deleted or changed significantly.
I would have to strongly disagree with your conclusion Joel. There is absolutely no reason to expect that two different genome sizes from two similar organisms indicates that large patches of DNA have “function that is not important enough that it can’t be deleted or changed significantly.” The differences in genome size might be a result of duplication. We know, for example, that some people have more copies of the amylase gene than others, probably because their ancestors had more carbohydrate-rich diets and thus needed higher rates of amylase production. It could well be that these very similar flies have different enough habitats, diets, ecological challenges, etc., that some of them need duplicates of sections of the genome in order to produce more of what is needed to survive. The difference in size also might be the result of deletion because the missing material is quite functional, but unnecessary for a specific species due to its specific habitat, diet, ecological challenges, etc.
There is no reason to expect that “missing” DNA doesn’t have an important function. All it means is that it is unnecessary for the specific organism in question. It could be very necessary for another very similar organism that has different biological needs.
Many genomes are highly redundant so that if one system fails another will kick in to take its place.
Third Way physiologist Dennis Noble has an interesting talk on this. Skip to 16:27 for this part:
“Simply by knocking genes out we don’t necessarily reveal function, because the network may buffer what is happening. So you may need to do two knockouts or even three before you finally get through to the phenotype. … If one network doesn’t succeed in producing a component necessary to the functioning of the cell and the organism, then another network is used instead. So most knockouts and mutations are buffered by the network… [at 19:40] Is this an unusual result, … or is it general? This study went through all 6000 genes in the organism yeast. knocking them out one by one. 80% of the knockouts were silent. So this physiological process of buffering against gene change is general. It’s usual in fact. Now that doesn’t mean to say that these proteins that are made as a consequence of gene templates for them don’t have a function. Of course they do. If you stress the organism you can reveal the function. .. If the organism can’t make product X by mechanism A, it makes it by mechanism B.” https://youtu.be/QMVfafAYTMg?t=16m27s
ENCODE noted this as well in 2012 when publishing their results:
“Loss-of-function tests can also be buffered by functional redundancy, such that double or triple disruptions are required for a phenotypic consequence. Consistent with redundant, contextual, or subtle functions, the deletion of large and highly conserved genomic segments sometimes has no discernible organismal phenotype, and seemingly debilitating mutations in genes thought to be indispensible have been found in the human population” http://www.pnas.org/content/111/17/6131.long
From an engineering perspective I think this is good design. Former Boeing engineer turned programming language designer Walter Bright is one of my favorite people to follow, although I have no idea what position he takes in the evolution vs design debate. He writes:
“All I know in detail is the 757 system, which uses triply-redundant hydraulic systems. Any computer control of the flight control systems (such as the autopilot) can be quickly locked out by the pilot who then reverts to manual control. The computer control systems were dual, meaning two independent computer boards. The boards were designed independently, had different CPU architectures on board, were programmed in different languages, were developed by different teams, the algorithms used were different, and a third group would check that there was no inadvertent similarity. An electronic comparator compared the results of the boards, and if they differed, automatically locked out both and alerted the pilot. And oh yea, there were dual comparators, and either one could lock them out. This was pretty much standard practice at the time. Note the complete lack of “we can write software that won’t fail!” nonsense. This attitude permeates everything in airframe design, which is why air travel is so incredibly safe despite its inherent danger.” https://news.ycombinator.com/item?id=6639097
Thanks, Joe. I plan to listen to the entire Noble talk, as it sounds fascinating!
I believe the bacteria in Lenski’s experiment have similarly had a reduction in genome size as they have jettisoned DNA not required in the lab environment. This provides an immediate benefit at the cost of long term adaptability; but evolution has no foresight.
An interesting example. One way of looking at it is that Ted has 2x the amount of data but it is 2 copies of the same information.
Jeff could be 98% identical in base matches but possibly 0% identical in information. Consider these two sentences;
“That is unsafe to eat” vs “That is safe to eat”.
They are very similar, you could even say 100% similarity after correcting for indels, but the information in each is totally different.
So both genome size and genome similarity could be poor methods of comparison.
Both “homologue” and “indel” assume an evolutionary connection but then using similarity calculated using these assumptions as evidence for evolution becomes circular reasoning.
This entire discussion is very interesting. Whatever the genomic similarity between humans and chimps, it is obvious that the two species are very different when it comes to physical and mental capabilities. Something has to account for those differences.
Humans have fine motor control that enables them to do things like playing a symphony on multiple musical instruments, sculpting remarkably accurate reproductions of things such as human or animal anatomy, doing needlecraft, flying aircraft, etc. On the other hand, the strongest and best trained one hundred fifty pound human cage fighter could be put in a completely enclosed fighting cage environment with a recently wild caught adult male chimpanzee of equal weight. Any attempt by the human cage fighter to subdue the untrained chimpanzee would be met with swift and probably fatal consequences to the well trained cage fighter. With no respect for genetic similarity, the chimp would probably then happily dine on the remains of the cage fighter.
My point is that no matter how similar the protein structure of the two species, there is a vast difference in how the proteins are expressed and organized. Whatever it is that accounts for those differences may not be obvious in the sequences of our genome, but it is blatantly obvious that there is more than a couple percent difference in the way our genomes are expressed.
Roy Britten showed years ago (2002) that, counting indels, the protein coding sequence in chimp and man differed by >5% (PNAS 2002).
It is all just a matter of defining and coding. Leaving out indels or coding them as SNPs makes 99% similarity. Leaving out indels and SNP makes chimp sequences men and vice versa.
Most of the data published went through a filter prior to the analyses, which throws out all sequences >95 dissimilar.
These studies do not make a lot of sense and do not contribute to any knowledge.