More than eight years ago (have I really been blogging that long?), I was excited to see the appearance of a new peer-reviewed journal, BIO-Complexity. I thought it was going to have a lot of impact on the science of biology, but so far, its impact has been minimal. A few good studies (like this one and this one) have been published in it, but overall, it has not published the ground-breaking research I had hoped it would.
That might have changed. I just devoured the most recent study published in the journal, and I have to say, it is both innovative and impressive. It represents truly original thinking in the field of biology, and if further research confirms the results of the paper, we might very well be on the precipice of an important advancement in the field of biological taxonomy (the science of classifying living organisms).
The paper starts by detailing the fact that while evolutionists have always hoped that living organisms can be organized into a tree of life (starting with one universal common ancestor and branching into all known organisms), that hope has never been realized. In particular, when we look at organisms on the genetic level, no consistent tree can be produced. Instead, a “tree-like” arrangement can be made, but it needs all sorts of rescuing devices to explain the many inconsistencies that crop up.
Nevertheless, the fact that the structure somewhat resembles a tree tells us something. It tells us that the organisms we see today contain a lot of commonalities. However, since no consistent tree can be constructed, it is doubtful that those commonalities are the result of evolution. How, then, can scientists understand the “tree-like” structure of biological relationships?
The author of this new paper, Dr. Winston Ewert, makes a suggestion that is both innovative and, at the same time, so obvious it makes me wonder why I haven’t heard it before.
He suggests that we look at organism relationships the way a programmer looks at relationships between different computer programs. These days, most computer programs aren’t written from scratch. There are standard modules that do specific functions, and most computer programs utilize those modules whenever they can. The only new computer code that is written performs functions that aren’t done by one of the available modules. For example, JavaScript (a popular coding language used in web applications) has two programs, one called “jsdom” and another called “node-gyp.” They do very different things, but they both depend on a module called “request,” which downloads files from the internet.
So these two computer programs share at least one commonality: the computer code that makes up the “request” module. If we didn’t know that these programs were created, we might suggest that perhaps they share a common ancestor which contained the “request” code, and that common ancestor passed it on to the lineage that gave rise to jsdom as well as the lineage that gave rise to node-gyp. But since we know both jsdom and node-gyp were created, we know that they simply share another created structure because they each need the function that it performs.
Now imagine a few complex programs that each do different things, but they each use many modules to get their jobs done. If we compared the programs, we might find some that share many, many modules and others that share only a few modules. Once again, if we didn’t know they were all created, we might say that the ones which share a lot of modules are closely-related on an evolutionary timeline, while the ones which share only a few common modules are distantly-related on an evolutionary timeline.
In other words, we might think that the relationships between these computer programs form a tree-like evolutionary structure. Of course, since the programs didn’t evolve from one another, the relationships between the programs wouldn’t fit perfectly into an evolutionary tree. Instead, like the current genetic relationships between animals, the relationships would form a tree-like pattern with many exceptions.
Is there something that explains the relationship between programs better than a tree-like structure? Yes. It’s called a dependency graph. In a dependency graph, computer programmers draw arrows from the individual programs to the modules that each program uses. For example, Dr. Ewert’s paper shows this simplified drawing for the dependency graph of certain JavaScript programs:
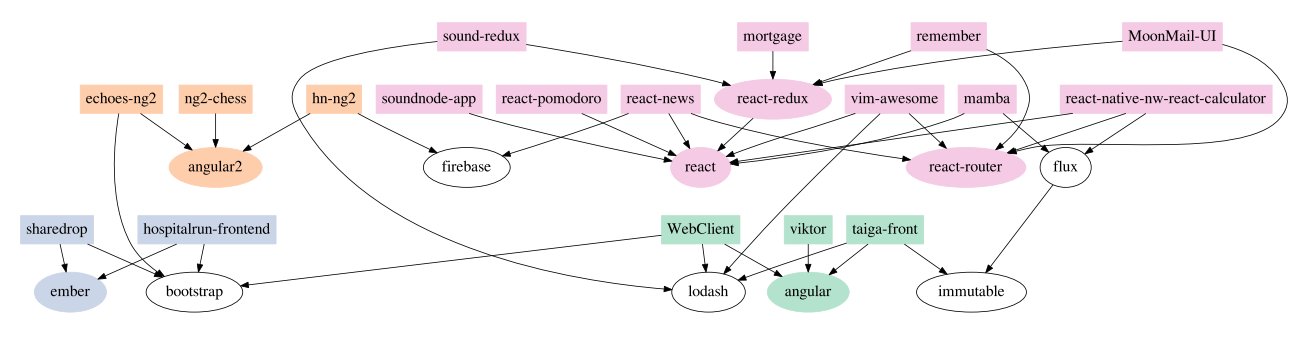
Each rectangle represents a program, while each oval represents a module of computer code. The arrows are drawn from the programs to the modules that the programs use. For example, the rectangle on the top left represents the program called “sound-redux.” The arrows indicate that it uses the “lodash” module and the “react-redux” module. The arrows tell us that the lodash module is used by three other programs, while the react-redux module is used by two other programs.
How does this all relate to biology? Well, let’s assume that the animals we see were designed something like these JavaScript programs. The Designer had genetic modules (groups of genes that perform specific functions), and the Designer simply used those modules when an animal needed to perform those functions. If that is the case, we could represent the relationships between animals in a dependency graph like the one below:

The rectangles on the bottom represent individual animals. The ovals represent groups of genes that perform specific functions. The “mammalia” oval, for example, is the group of genes that produce the basic characteristics of mammals (warm-blooded, hairy, nourish young with milk, etc.). The “Laurasiatheria” oval contains the genes used by animals that nourish their developing embryos with a placenta. The “Carnivora” oval represents the genes used by carnivores for metabolism. Now look at the middle rectangle on the bottom (domestic dog). It uses the Carnivora module (because it’s a carnivore), and the Carnivora module uses the Laurasiatheria oval (because carnivores nourish their embryos with a placenta), and that module uses the Mammalia module (because placental animals have the characteristics of mammals). So the domestic dog uses the Carnivora, Laurasiatheria, and Mammalia modules.
So here’s the question: Which represents our knowledge of animal relationships better? An evolutionary tree, or a design-based dependency graph? Well, the author of this paper has run several tests, and his conclusion is that the dependency graph does a much better job.
How can he say that? First, he wanted to make sure that a dependency graph is significantly different from an evolutionary tree. So he used an evolution simulator (EvolSimulator) that specifically simulates the supposed evolution of genes. He ran the simulation five times, changing the input parameters each time to get five different evolutionary scenarios. In each case, the genetic data were better ordered as a tree than as a dependency graph. Not surprisingly, then, the dependency graph doesn’t do a great job of showing the relationships among evolved genes.
He then analyzed a set of JavaScript applications. Not surprisingly, he found that a dependency graph described the relationships among the programs better than an evolutionary tree. Thus, at least when it comes to simulated evolution and computer programs, a dependency graph fits the designed things better than an evolutionary tree, but an evolutionary tree fits the evolved things better than a dependency graph.
Now we come to Dr. Ewert’s main test. He looked at nine different databases that group genes into families and then indicate which animals in the database have which gene families. For example, one of the nine databases (Uni-Ref-50) contains more than 1.8 million gene families and 242 animal species that each possess some of those gene families. In each case, a dependency graph fit the data better than an evolutionary tree.
This is a very significant result. Using simulated genetic datasets, a comparison between dependency graphs and evolutionary trees was able to distinguish between multiple evolutionary scenarios and a design scenario. When that comparison was done with nine different real genetic datasets, the result in each case indicated design, not evolution. Please understand that the decision as to which model fit each scenario wasn’t based on any kind of subjective judgement call. Dr. Ewert used Bayesian model selection, which is an unbiased, mathematical interpretation of the quality of a model’s fit to the data. In all cases Dr. Ewert analyzed, Bayesian model selection indicated that the fit was decisive. An evolutionary tree decisively fit the simulated evolutionary scenarios, and a dependency graph decisively fit the computer programs as well as the nine real biological datasets.
Now, of course, this isn’t the final word on the subject. Indeed, Dr. Ewert specifically says that a lot more research has to be done, fleshing out the exact nature of the dependency graph that describes animal relationships as well as adding non-animal organisms into the mix. Nevertheless, the early results are very encouraging.
It will be interesting to see how this kind of analysis progresses, but it looks like Dr. Ewert has uncovered a fundamentally new and better way of understanding biological relationships. If so, this is destined to be considered a revolutionary paper.
********
ADDENDUM: The author of this study contacted me. It turns out that he was homeschooled and used my courses. I am thrilled to think that I had a small impact on the education of someone who has authored such an excellent study!
I attended your session on Christianity and Science this past weekend in STL where you mentioned you would soon be blogging on this topic. I read your post, as well as about half of the original article. I was curious what was being said about the article and found a dialog that will probably interest you. I am extremely impressed with the civil nature of the conversation from both sides. https://discourse.peacefulscience.org/t/winston-ewert-the-dependency-graph-of-life/728/14
Thanks for sharing that discussion. It is interesting and, as you note, quite civil.
Wow, this is an absolutely amazing paper, and a fresh new, powerful argument for Design. And your explanation really helped to break it down! Question: Do you know of / or have you written anything that explains the problems with evolutionary trees (from morphology and / or genetics)? I know there’s a lot out there to shuffle through, but you’re so good at explaining things, I thought maybe you knew of something or have written something on the subject?
Here is something I wrote about that:
http://blog.drwile.com/is-dna-providing-a-coherent-view-of-evolution/
Good afternoon Jay,
Cornelius Hunter at darwins-god.blogspot.com has an interesting review of the same paper and looks at the Bayesian model results and gives a perspective of what the results mean. So if this paper is backed up by further research, it will be very interesting to see how evolutionists rebut the findings.
May our Lord and God continue to bless you and yours in the days and weeks ahead.
I think Dr. Hunter is missing a key element of the Bayesian model selection results. The numbers are large just because there are a lot of data points in the analysis. While the technique does indicate the selection is decisive, it awards bits per data point. The more data points, the larger the results will be. This makes sense for model selection, but with large data sets like Dr. Ewert used, the scores are a bit inflated.
Hello all. It is a good paper. Happy to answer an questions on our forum. Winston made a great showing. I’d avoid Hunter’s work. That really undermine’s Ewert’s credibility. https://discourse.peacefulscience.org/t/winston-ewert-the-dependency-graph-of-life/728
Best explanation on Dr Ewert’s paper I’ve read. Thank you Dr Wile for such a clear and impartial explanation.
What a great site and resources! God Bless!
@Swamidass Wouldn’t Ewert have to be the one to undermine Ewert’s credibility?