
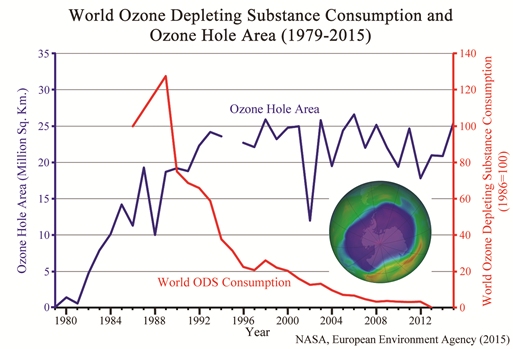
A reader sent me this article and asked for my thoughts on it. It discusses the fact that the ozone “hole” over Antarctica grew 22% from 2014 to 2015. It presents the graph shown above, which demonstrates that despite the fact that the worldwide use of chemicals known to destroy ozone has dropped to nearly zero, the size of the ozone hole has not really decreased. It points out two studies that claim the ozone hole will shrink in size by either 2020 or 2040, and it concludes with this sentence:
But the longer the hole persists, the greater the likelihood that the ozone layer is dominated by natural factors, not human CFC emissions.
So what’s the story? By banning the use of CFCs, which we know can destroy ozone in the ozone layer, did we really fix the ozone “hole” problem? Or did we, as this story seems to imply, try to fix something that is probably the result of earth’s natural variability?
The first thing you need to know is that the ozone “hole” isn’t really a hole. It is a reduction in the amount of ozone that exists within the ozone layer, a portion of earth’s atmosphere that is roughly 15-35 kilometers above the surface of the earth. While all portions of the atmosphere have some ozone in them, this portion has the highest levels. Ozone’s molecular structure allows it to absorb some of the ultraviolet light that comes from the sun. That’s good for us, because ultraviolet light is energetic enough to kill living tissue. You can therefore think of the ozone layer as a “shield” that protects us from most of the sun’s ultraviolet light.
The amount of ozone in the ozone layer is measured using Dobson Units (DU). The larger the number of Dobson Units, the more ozone there is in the ozone layer. Globally, the average amount of ozone in the ozone layer is about 300 DU, but in Antarctica, that number fluctuates significantly with the seasons. While there are times the amount of ozone in the ozone layer above Antarctica is 300 DU and higher, there are also times it is significantly lower. The lowest recorded level of ozone in the ozone layer above Antarctica was in September of 1994, when there were only 74 DU of ozone. That reduction of ozone is what scientists refer to as the ozone “hole.”
Why does the amount of ozone in the ozone layer above Antarctica change with the seasons? Because during Antarctica’s winter, the polar vortex develops. This large ring of wind blows above the continent, and it produces a series of events that eventually lead to ozone destruction. When the polar vortex breaks up (usually in October), ozone destruction stops, and the level of ozone in the ozone layer above Antarctica rises again. So when we talk about the ozone “hole,” we are talking about a seasonal drop in ozone levels in the ozone layer above Antarctica. (There is a similar “hole” above the Artic, but it is small compared to the one above Antarctica.)
Now that you have all that information under your belt, you are ready for what I think is the most illustrative graph related to the ozone hole. Every year, NASA records the maximum size of the ozone hole as well as the minimum level of ozone found there. The following graph shows you both. The maximum size of the ozone hole in square kilometers is given in blue, and the minimum level of ozone in the hole is given in red. Please note that to make the graph easier to read, I divided the level of ozone by 2:
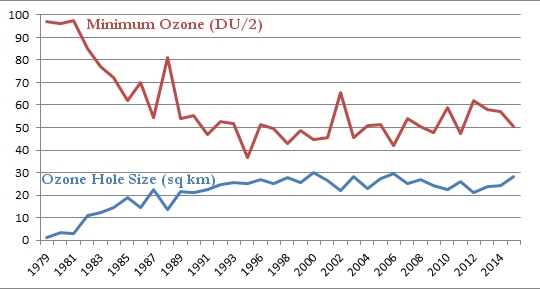
As was shown in the graph at the top of this post, the size of the ozone hole grew in a shaky but steady fashion until about 1998, and it has remained roughly the same since. Thus, while the ozone hole is no longer growing, it isn’t shrinking, either. Look, however, at the minimum level of ozone in the hole. It declined in a shaky but steady fashion until 1994, but it now seems to be growing in a shaky but steady fashion. The growth is very slow, but it seems unmistakable. So while the size of the ozone hole isn’t decreasing, the level of ozone in the ozone hole is rising.
My interpretation of the data, then, is that the ozone hole is recovering, but very slowly. Why is the recovery so slow? Based on the chemistry of CFCs, this is exactly what you would expect. One of the reasons CFCs became so popular is that they are fairly inert. They don’t like to react with much of anything on the surface of the earth. As a result, they are not toxic. However, because of that, they also don’t decay very quickly. This means that even though we have stopped using CFCs, there are still a lot of them in the environment, and it will take a long time for them to decay away. Until they do, they will continue to destroy ozone when the polar vortex forms.
In the end, then, I do think the data tell us that the reduction in CFC use has helped the ozone layer. However, due to the chemical nature of CFCs, it will take a while for this to have a strong effect on the depth and size of the ozone hole.
That sounds like good news, Dr. Wile. The long recovery time should serve as a cautionary tale for anything else we may be doing to our planet.
I’ll add that an additional factor could be that even though we have restricted CFCs in the west, the rest of the world may not be following suit as quickly. The following link is to a report on illegal trading of CFCs worldwide [http://web.archive.org/web/20140923002205/http://www.ipcc.ch/pdf/special-reports/sroc/sroc11.pdf].
I am sure there is a “black market” in CFCs, as there is in pretty much everything. However, please note that the upper graph does show worldwide ozone-destroying chemical consumption.
I never agreed man was affecting the great global ball we live on. Its a myth. Any O hole was likely there in 2014BC. its more likely its due to physics of forces. Also the equipment to test it must be of recent invention.. Keep a eye on that variable. Then intergrity.
If it actually is reduced from some verified size from decades ago then indeed mans the cause of the hole size.
Anyways it never made a difference .
Its all been the upper classes attempts to make a greener cleaner world and easily accepted the pollution fear.
I’ll have to disagree with you, Robert. The graph clearly shows that the ozone hole developed over time. Since we know that CFCs can destroy ozone in the polar vortex conditions, and since we know CFC concentrations in the ozone layer increased over the time that the ozone hole grew and the amount of ozone in the hole decreased, there is strong evidence that the ozone hole is something we produced. Of course, new information might invalidate this conclusion, but based on what we know now, I think it is the most reasonable one to make.
Also, man does affect the great global ball we live on. We shot the passenger pigeon into extinction, for example. We have radically altered the ecosystem in parts of the ocean. There are many such examples.
I have little knowledge of this topic but I would tend to agree that CFC’s were a significant factor.
However, citing a graph that starts in 1979 has it’s significant problems. First of all we don’t have ozone data from 99% of the earth’s history so we have no idea of cause and effect in natural history to go by. And also, I am fairly confident that the global warmists typically pick a starting date of data that best supports their position. So start you statistical chart at the lowest temperature year and it will support your theory. One of the oldest statistical tricks in the book. Now I am not saying the ozone chart is a trick but since we don’t have past data how can we know that the starting point is not a natural low point so the increasing hole looks far worse that it actually is?
And lastly, the more I read about scientific pronouncements it seems the more times they are ‘surprised’ later that what they found didn’t support their hypothesis. So it’s a ‘fool me once’ deal, I’m not getting burned again so easily by accepting these guesses by men and women who often have agenda and money at stake behind their studies.
Ok, rant completed!
John, I would agree that you have to be skeptical of any graph that doesn’t show a large portion of earth’s history. At the same time, however, in the case of this graph, we see a decrease in ozone in the hole as CFCs are used, a leveling off as CFC use is curtailed, and a rise in the amount of ozone after CFC use is curtailed. To me, that’s convincing. Also, I don’t see the slow rise in ozone levels or the stubborn refusal of the ozone hole to shrink as surprising. Once again, it is what you expect from the chemistry of CFCs.
Do you still believe it was a mistake to ban CFCs? I believe I recall you saying something to that effect in one of your HS textbooks.
I do still believe it was a mistake to ban CFCs, Noah. Remember, when you do something, you must perform a cost/benefit analysis to see if the benefit is worth the cost. Unfortunately, I have never seen such an analysis. Based on my understanding, I would think that more people have died as a result of the CFC ban due to the fact that fires cannot be extinguished as readily, refrigeration is less efficient, etc.
I have never questioned that CFCs were a major cause of the ozone hole. The data have been clear about that for a long time. What I question is whether we should have gotten rid of chemicals that save lives to fix a seasonal problem that exists only over the poles. I am willing to be persuaded by a serious cost/benefit analysis, but I have never seen one.