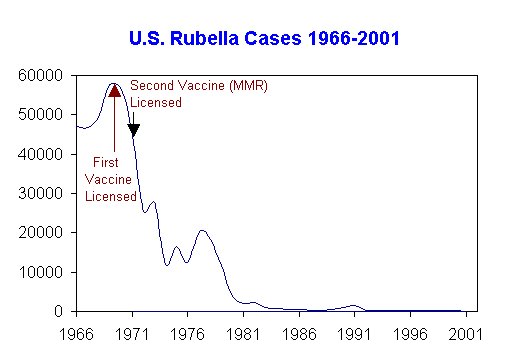
The history of rubella in the United States gives another excellent example of how disease rates plummet when vaccination occurs. The following graph shows rubella cases from 1966 (the first year rubella was a nationally notifiable disease) to 2001:1

Notice that the incidence of rubella did not begin to fall until the vaccine was licensed in 1969. The greatest decrease came after the second (combination) vaccine, the MMR, was licensed. Notice also that the decrease in the rubella rate started in about 1970. Remember from the previous graphs of polio and measles that the significant decrease in the measles rate started in 1964, while the significant decrease in the polio rate started in 1955. This makes it obvious that improved sanitation is not the reason that these diseases declined. If improved sanitation were the explanation, the diseases should all decline at roughly the same time, not spread out over a period of 15 years!
The trend that I have shown for polio, measles, and rubella exists in other countries for other diseases as well. For example, the UK’s department of health has tracked the case rates (and death rates) of many diseases in the UK. Their data also show the dramatic efficacy of vaccines. Click on the links to see the dramatic decline in these diseases in the UK, thanks to immunization:
Diphtheria Rate plummeted in 1944, just after diphtheria immunization was introduced
Measles Rate plummeted in 1968, just after measles immunization was introduced
The conclusion should be clear – disease rates plummet once vaccination is introduced.
References
1. Morbidity and Mortality Weekly Report, Volume 42:#53 (1994),p. 95 Volume 50:#53 (2003), p. 119
Dr. Wile and Erica A. Sommerville are not medical doctors. Dr. Wile is a nuclear chemist, and Miss Sommerville is a college student. As a result, they do not dispense medical advice. They simply educate the public about scientific issues. Please consult a board-certified medical doctor before making any medical decisions for yourself or your family.
