From the days I started doing scientific research, I have seen that politics play far too great a role in science. Some of this stems from the fact that most basic research is funded by the federal government, and since politicians control the money, they inevitably exert influence on what kind of scientific research is done. Over the years, however, I have observed a nasty, growing trend of scientists’ own political views influencing the way they handle data and communicate their results. In some fields, the political influence is worse than it is in others, and climate science might be the most politicized field of them all. A story posted on Dr. Judith Curry’s blog is the latest in a series of revelations that show us just how bad this has become.
Starting in the late 2000’s, those who had been studying worldwide temperatures noticed that the average temperature of the earth was not increasing. This was troubling for those who believed in human-produced global warming, since the models upon which they base most of their conclusions suggest that the earth’s average temperature should be increasing with increasing levels of carbon dioxide. As time went on, this lack of warming became more and more difficult to understand under the human-produced global warming paradigm, and critics of the paradigm started calling it “The Pause.”
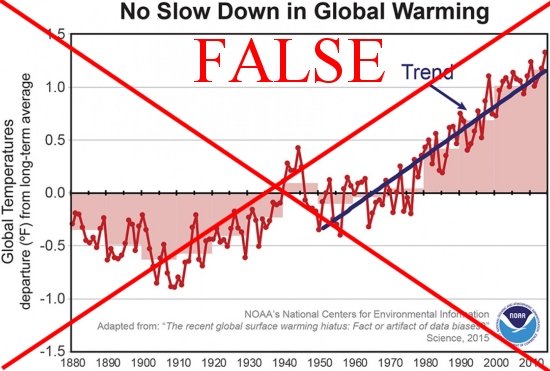
In 2015, however, scientists from the the National Oceanic and Atmospheric Administration (NOAA) produced a report that was published in Science, one of the world’s most prestigious scientific journals. According to this report, “The Pause” was an artifact of the way earlier temperature analyses were done. When those analyses were “corrected,” there was no “Pause.” As shown in the NOAA-generated graph above, the trend of global warming had remained constant since the early 1950s. While slower than predicted by the models, it had not slowed down in recent years at all. As a result of its conclusion, this paper became known as the “Pausebuster” paper.
Interestingly enough, the Pausebuster paper was published about six months before the United Nations Climate Change Conference in Paris, France. Critics of the paper noted this timing and argued with the conclusions. In fact, another prestigious scientific journal, Nature, published a paper in 2016 (after the Paris conference) that strongly argued against the conclusions of the Pausebuster paper. We now know for certain that this 2016 paper is correct, and that the scientists who produced the Pausebuster paper disregarded the NOAA’s protocols in the process of producing their paper. How do we know this? Because the scientist who wrote some of those protocols has finally spoken out.
Dr. John Bates holds an earned Ph.D. in Meteorology from the University of Wisconsin-Madison. He has spent his entire scientific career at the NOAA, the last 14 years of which he was a Principal Scientist at the NOAA’s National Climatic Data Center. He earned the NOAA Administrator’s Award in 2004 for “outstanding administration and leadership in developing a new division to meet the challenges to NOAA in the area of climate applications related to remotely sensed data.” He also earned a U.S. Department of Commerce Gold Medal in 2014 for visionary work in the acquisition, production, and preservation of climate data records. He retired from the NOAA in November of last year and now feels comfortable about exposing the way politics has corrupted the science being done there.
His article is long and detailed, and it is focused on the ways in which the NOAA handles its temperature data. Most people see graphs of global temperatures over time and think it is a fairly straightforward thing to measure: Put a bunch of thermometers all around the world and average them. It’s as simple as that! If you read his post, you will find that it is much more complicated! Add to that the fact that the trends seen in the data using thermometers are different from those seen using weather balloons and satellites, and you will see that anyone who claims we understand global temperature trends doesn’t know much about how such trends are measured!
I think the more illustrative source to read when it comes to Dr. Bates’s horrible revelations is The Daily Mail’s article based on their exclusive interview with him, which is also linked in his article on Dr. Judith Curry’s blog. The interview focuses on how the Pausebuster’s scientists did everything they could to bias their data towards the conclusion that the earth is still warming.
Probably the most egregious action taken by the Pausebuster’s authors was the way they approached the temperatures measured on the surface of the ocean. As you might expect, there are many thermometers floating on buoys on the ocean, and those thermometers are a substantial source of data on global temperature, since the surface of the earth is more than 70% ocean! The scientists decided that the thermometers on these buoys were reading temperatures that were too low. Why? Because they disagreed with the temperatures of water taken in by ships. The ship-based temperatures were warmer, so the authors decided to “correct” the buoy temperatures with the ship-based temperatures.
Think about that for a moment. Which is a more accurate measure of sea surface temperature? The reading of a thermometer floating on the ocean, or the reading of a thermometer in water that has been taken in by a warm ship? Obviously, the buoy temperatures are more accurate. However, they were “adjusted,” because using ship-based data in the adjustment produced the warming trend that the authors wanted! As Dr. Bates says in the interview:
They had good data from buoys. And they threw it out and “corrected” it by using the bad data from ships. You never change good data to agree with bad, but that’s what they did – so as to make it look as if the sea was warmer.
Despite the horrible revelations made by Dr. Bates in his article on Dr. Curry’s blog and his Daily Mail interview, I actually found Dr. Curry’s statement about this situation to be the most revealing. After giving her readers some background information about her collegial relationship with Dr. Bates and how she came to publish his piece on her blog, she says this:
Being retired sure is liberating…
To anyone who is a scientist, that should send chills up and down your spine. She is essentially saying that the only reason she can voice her scientific opinions and Dr. Bates can come forward with his report of scientific irregularities is because they no longer need to worry about harming their professional careers as scientists. If that doesn’t convince you that politics have poisoned science, I don’t see how anything ever could.
As another perspective on this whitleblow:
“In a post for Carbon Brief, Hausfather noted that NOAA’s updated dataset doesn’t cause it to show more warming than the datasets run by NASA, the Berkeley team, and the UK Met Office. Instead, the update caused NOAA to stop showing less warming than everyone else.”
https://arstechnica.com/science/2017/02/article-names-whistleblower-who-told-congress-that-noaa-manipulated-data/
ArsTechnica certainly holds a pro-warming bias, but if independent datasets do confirm the revised NOAA numbers, that’d be pretty telling.
That’s definitely not correct, Ward. The 2016 paper that argued against the Pausebuster paper has a graph (figure 1) comparing the Pausebuster temperatures with the UK Met Office temperatures (HadCRUT4.4). The Met temperatures start off higher in 1950 and end up lower for the last year in the study. Thus, the Met office temperatures show less warming than the Pausebuster temperatures.
Very telling article. I have two questions for you Dr. Wile.
1. I was reading about the Pan Evaporation Paradox and was wondering if you think decline in evaporation rates over the last 50 years also confirms we are not in a warming cycle. It seems science is trying hard to dismiss it.
2. This is probably a more personal question and may not be appropriate for public forum, but do you have a cynical side ?
To me it’s obvious that if you continue throw money at something, it continues to persist. I wonder why governments give Climate Change such a prominent place in the grant hierarchy. Is this due to actual belief, pride, … or maybe something a little more strategic – financial gain? In watching the trailer for “Before the Flood”, I noticed the editors chose to include a protester holding a nice big, clearly written sign on which were written three words – “Carbon Tax Now”. Surely a worldwide carbon tax will generate a nice return on all that federal money.
Thanks, John. In answer to your questions:
1. My information may be out of date, but I thought the pan evaporation paradox was solved in the late 1990s. According to that study (and others done in the early 2000s), the hydrologic cycle’s turnaround time has reduced. This leads to a larger average moisture content in the air, which reduces evaporation. I haven’t looked into this for some time, however, so something else might have come up to falsify that line of reasoning.
2. I try not to assign motives, because people incorrectly assign motives to me. For example, I have been told by evolutionists on many occasions that the only reason I am a creationist (or at least pretend to be one) is because I know I can make money writing creationist textbooks. From the other side, I have been told that I don’t toe the standard creationist line on what it means to take the Bible literally because I want to be taken seriously by old-earth creationists and theistic evolutionists. Neither of those motivations are anywhere close to correct. I would hate to insult others the way I have been insulted, so I just avoid the entire issue. Regardless of motivation, I think we all can agree that violating your agency’s rules is wrong, and bad data should not be used to “correct” good data.
You are right… For some reason I thought there was more of a debate about pan evaporation… However I did come across this paper which seems to imply pan evaporation is more consistent with oscillating climate.
https://www.ncbi.nlm.nih.gov/pmc/articles/PMC5172234/#!po=40.8537
I think you have taught me something very important about assigning motives. Although I do think sometimes it may be helpful to wonder aloud about these things without directly accusing anyone – it might help us be better prepared for what transpires.
Ah, the beauty of “consensus science”.
Politics indeed does play too great a role in our discussions of climate change, and that goes equally (or maybe even more so) for the right as for the left. The political manipulations regarding climate science on the right should send chills up and down one’s spine as well. There are certainly those who want to use climate science to justify all sorts of leftist agendas, such as population control or socialism. And there are those on the right who dismiss any possibility of detrimental climate change due to human activities for political or philisophical reasons rather than scientific reasons (Jay, I’m not saying you do this).
Was there a pause in global warming from 1998 to around 2013? I think the answer is both yes and no. On the yes side, I could reference any number of graphs that show a temperature peak in 1998, and then a random up and down temperature pattern for the following fifteen years. Of course, picking an exceptionally warm year as the beginning of the fifteen-year pause in itself biases the trend for the period.
But if one looks at just the El Niño years during this time period, the upward temperature trend continued unabated. And if one looks at only the La Niña years during the same time period, the upward trend is also apparent. So from this perspective, the pause only appears because La Niña years and ENSO-neutral years outnumbered El Niño years during the fifteen year period from 1998 to 2013. A graph showing this may be found in many places, including https://www.skepticalscience.com/graphics.php?g=67.
Federal agencies have scientific integrity programs, and federal scientists (such as myself) have an obligation to report breeches of integrity that they can verify. I haven’t followed the current accusations by John Bates all that closely, but there do seem to be some good rebuttals out there, such as http://icarus-maynooth.blogspot.co.uk/2017/02/on-mail-on-sunday-article-on-karl-et-al.html and https://www.carbonbrief.org/factcheck-mail-sundays-astonishing-evidence-global-temperature-rise. It appears that Dr. Bates may have misunderstood the ocean buoy data, and how these were integrated with data from ships.
Thanks for the rebuttal sites, Kevin, but they don’t defend what was done in the Pausebuster paper, as the 2016 peer-reviewed paper linked in the original post demonstrates. In addition, I don’t think Dr. Bates misunderstood the ocean buoy data. The rebuttal site claims that the buoy data were weighted more heavily. That doesn’t change the fact that bad ship data were used as a “correction.” The buoy data represent what is going on in nature. The ship data represent what happens when artificial systems are used to interfere with what is happening in nature. Thus, Dr. Bates is quite correct in saying that they threw away good data for bad data.
Here are rebuttals of several of the statements on the websites you linked.
This looks really interesting and quite significant! Is there a graph available to help visualize what “The Pause” looks like? Also, a friend tells me that the last 4 years have been the hottest on record temperature-wise. Is that true? Thank you.
Here is an NOAA graph produced without the “Pausebuster corrections.” Notice that starting in the late 1990s, the trend becomes a flat line. That’s the “Pause.” Now please note that these thermometer-based temperatures are in disagreement with the satellite-based temperatures, which also show the “Pause” but have a much smaller trend overall.
When it comes to the “hottest years on record,” that depends on the dataset you are looking at. Based on thermometer-measured temperatures, the past three years have been the hottest on record, with the fourth hottest being 2010. Based on the satellite data, 2016 was the hottest year on record, edging out 1998 by 0.02 degrees C. 2015, 2014, and 2013 were above average but not the hottest on record.
Please note that the rankings of “hottest” years change, because the thermometer-based measurements went through a major adjustment between 2013 and 2014, which changed history. Note that in the link I gave before, 2016 thermometer measurements said that the rank in terms of temperatures were 2016 (hottest), 2015, 2014, 2010, 2013, 2005, 2009, 1998. Now look at the same agency’s analysis for 2013. If the 2013 list is to be consistent with the 2016 list, the order should be 2010 (hottest), 2013, 2005, 2009, 1998. Instead, it is 2010 (hottest), 2005, 1998, 2013, 2003.
This is why I say in the post that anyone who claims that we understand global temperatures doesn’t know how those temperatures are measured. The two major datasets (thermometers and satellites) can’t agree on the warming trend or even the hottest years on record. Even the same dataset (thermometers) give you different results depending on the year in which you analyse them!
Reminds me of how some people let their religious beliefs distort their interpretation of scientific data, for fear of harming their religious beliefs.
Indeed, like those who are unwilling to consider the design analysis of nature because of their unwillingness to grant the possibility of a creator God.
Is it publicly known that they are adjusting the readings from the buoys? I saw a meme a few months ago that stated “90-99% of all scientist agree that global warming is real” It may appear that they might not be informed on the subject. Of course, they know a lot more than me, but not everything.
I suspect the vehement push for man-caused global warming is for diabolical purposes
It is certainly not publicly-known. Indeed, Bates had to “blow the whistle” on what happened in the case of the sea surface temperature. There are all sorts of adjustments going on, and most of them do seem to be designed to enhance warming.