
Dr. Lewis Thomas, in his book, Lives of a Cell: Notes of a Biology Watcher, says that the best kind of medical technology is, “…the kind that is so effective that it seems to attract the least public notice; it has come to be taken for granted. This is the genuinely decisive technology of modern medicine, exemplified best by the modern methods for immunization against diphtheria, pertussis, and the childhood virus diseases.”1 Indeed, over the years, vaccines have become so effective at eliminating disease that they have become taken for granted. So much so that there is a growing movement trying to claim that vaccines do not even help to prevent disease. Nothing could be further from the truth! Vaccines have saved the lives of countless children and adults over the years, and anyone who truly cares for children cannot ignore this rock-solid fact.
There are three main ways that we want to demonstrate the efficacy of vaccines. First, we want to show you the historical data that demonstrate how disease rates fell dramatically as a result of mass immunization. Second, we want to discuss some of the detailed, controlled studies that demonstrate that people are significantly less likely to be infected by a disease against which they have been vaccinated as compared to those who have not been vaccinated. Finally, we want to discuss the devastation that occurs when vaccination rates drop in a population.
Let’s start with the historical data. Below, you will find two graphs showing you the polio and measles rates in the United States from 1944 to 2001:2
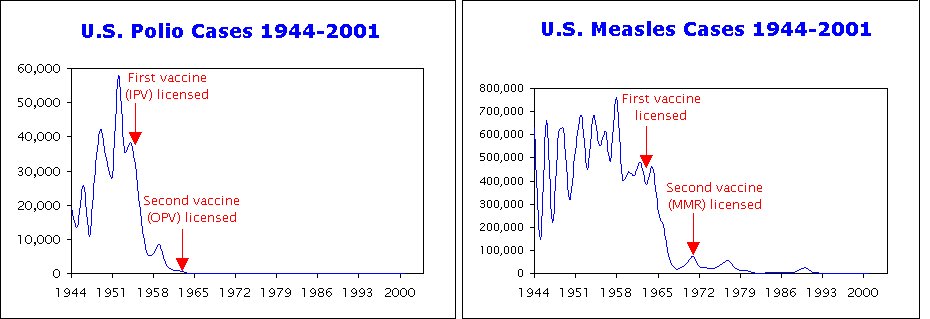
There are several important things to notice regarding these graphs. First, notice that in the case of polio, disease rate rose in a shaky but steady fashion from 1944 to 1952. Then, there was a slight (34%) decrease in the disease rate from 1953 to 1955. However, from 1955 to 1957, there was a dramatic decrease (80%) in the disease rate. What explains these drops in disease rate? Well, notice that the first polio vaccine was licensed in 1955. The dramatic decrease in disease rates, then, came right after the polio vaccine was licensed. What about the smaller decrease from 1953 to 1955? Well, Salk developed his vaccine in 1952 and began testing it. For example, in 1954, the Salk vaccine was tested in a double-blind study of 1.8 million children3. Thus, the benefits of the vaccine are apparent even in the testing phase!
Now look at the graph for measles. Once again, the story is similar. There is not nearly as much of a rise in the measles rate in the early years (1944-1958), but the disease rate follows the typical shaky pattern of epidemic cycles that is often seen in infectious disease rates. However, once again, there is slight decrease in the disease rate just prior to the licensing of the vaccine (during the testing phase), and then a dramatic decrease in the disease rate after the licensing of the vaccine.
Do these graphs demonstrate conclusively that the polio and measles vaccines stopped these dreaded diseases? Of course not. After all, this could all be explained by an amazing coincidence. Perhaps something else stopped each of these diseases, and that “something” just happened to occur during the testing and licensing phases of the vaccine. However, it does add some evidence to the pile. If you truly want to believe that vaccines are not effective, you have to believe in a couple of amazing coincidences in order to explain this data. Of course, this is not the only data available. We can look at other diseases whose infection rates dropped dramatically after the vaccine was introduced. Thus, the number of coincidences in which you must believe (if you think that vaccines are not effective) just keeps increasing!
There is one other very important thing to note from the graphs. Anti-vaccination advocates often try to explain the dramatic decrease in vaccine-preventable diseases in terms of increased sanitation. They say that these disease rates are so low because we have developed better sanitary practices over the years. However, these graphs show that this is just not true. After all, the polio disease rates decreased dramatically in the late 1950s. However, the measles rates did not decrease dramatically for another 10 years. If good sanitary practices were responsible for the drop in disease rates, you should see the disease rates fall roughly at the same time. That’s just not the case. The disease rates fell only when vaccines were tested and then approved. Also, note the short time over which the disease rates fell so dramatically. Do sanitation practices change so quickly that they completely “clean up” a country in a matter of a few years? Definitely not! Improved sanitation just does not explain the data.
In fact, most medical historians blame increased sanitation for the rise in polio from 1944 to 1952. When sanitary practices were rather poor, people were regularly exposed to small amounts of the polio virus, usually when they were babies and therefore had the extra protection given to them by the antibodies they received through their mothers’ milk. Their immune systems were able to conquer the weak exposure to the virus with the help of their mothers’ antibodies, and thus they became immune. As a result, the poor sanitation was actually acting like a “dirty” vaccine! As sanitary practices improved, fewer people were exposed to small amounts of the virus as infants. As a result, when they were exposed to concentrated amounts of the virus (from a person who already had the disease, for example), they would succumb to the disease4. Note that this makes sense in the light of the data, because the rise in the polio rate occurred slowly, which is what you expect when sanitation is playing a role.
Although these graphs are very effective illustrations of the power of vaccines, as we stated before, they are not definitive evidence. After all, coincidences could explain the graphs. By far, the best evidence of how effective vaccines are comes from controlled studies. In these studies, vaccinated people are compared directly to unvaccinated people, and the results are astounding.
For example, Feikin and others studied all measles and pertussis cases among children (age 3-18) in Colorado from 1987 to 19885. When they compared the vaccinated children to the unvaccinated children, they found that vaccinated children were 22.2 times less likely to contract measles than were the unvaccinated children. In the same way, vaccinated children were 5.9 times less likely to contract pertussis than were unvaccinated children. In other words, according to this study, if you do not vaccinate your children, you have increased their risk of getting measles by 2,220%, and you have increased their risk of getting pertussis by 590%!
Another finding from this study is that schools in which outbreaks occur have 2.9 times the percentage of unvaccinated students as do schools in which outbreaks do not occur. Thus, this study tells us that those who do not vaccinate their children are not only putting their own children in danger, but they are also putting other people’s children in danger, because the larger the number of unvaccinated children in a group setting, the more likely an outbreak is to occur.
Another study by Salmon and others was even more comprehensive but focused only on measles. They studied measles cases over seven years (1985-1992) using the Center for Disease Control’s Measles Surveillance System6. In their study, they found that vaccinated children (ages 5-19) were 35 times less likely to contract measles than were unvaccinated children. Another important result of their study was that the general measles outbreak that was seen in 1991 (note the small bump at 1991 in the measles graph above) actually started a year earlier among the unvaccinated population. In other words, that outbreak was most likely started by the unvaccinated population! This is another example of parents that do not vaccinate actually putting everyone’s children at risk.
These kinds of studies are done on all vaccines, and the results are just as stunning. In a double- blind, placebo-controlled trial of the flu vaccine, for example, 1,602 children were given a flu vaccine or placebo. Vaccinated children were 13.6 times less likely to catch the flu than those who got the placebo7. That study was expanded to a second year for 1,358 of the children and, in addition, 4,561 adults were added to the study. Once again, those who received the flu vaccine were many times less likely to get flu than those who received the placebo8. Even in the elderly, the flu vaccine is very effective at preventing illness. According to a meta-analysis done on flu-related data in seniors, the flu vaccine reduced mortality rates in people 65 years and older by 50%9.
We could go on and on, but the results are quite clear. When vaccinated people are compared to unvaccinated people, the vaccinated ones are significantly less likely to contract the disease than the unvaccinated ones. Thus, controlled studies clearly show that vaccines are quite effective.
A particularly sad way of illustrating the effectiveness of vaccines is to see what happens when vaccination rates in a population are low. Consider, for example, the following graphs of pertussis rates in the United Kingdom10:

The graph on the left shows the number of pertussis cases in the UK per year along with the number of pertussis deaths per year (multiplied by 60 so that you can see them on the graph) from 1940-1997. Notice that the disease rate is steady but shaky (as is typical for infectious diseases) until mass immunization begins. As vaccination becomes standard practice, the disease rate decreases.
Now look at the graph on the right. This graph contains the same data (pertussis cases and pertussis deaths – this time multiplied by 700) along with the pertussis vaccination rate from 1966 to 1997. Notice what happened in 1972-1973. The vaccination rate began to decline. This was caused primarily by anti-vaccination advocates who made claims that the pertussis vaccine was linked to devastating side effects such as SIDS. (Detailed, controlled studies show that the DPT vaccine actually lowers a child’s risk of SIDS11-13). Notice what happened as the vaccination rate went down – the disease rate went up. This kind of data is nearly impossible to explain if you think that vaccines are not effective. Clearly there was no appreciable difference in sanitation, nutrition, etc. during the1970’s. Nevertheless, that period saw an increase in the number of pertussis cases, and it coincides perfectly with a lowering of the vaccination rate. Then, once the vaccination rate increased again, the disease rate decreased in kind.
While looking at graphs like the one above is very instructive, it is important to note that these data are more than just numbers. They represent innocent children who suffered (and sometimes died) because their parents (or others who were in charge) were fooled by anti-vaccination advocates. The death of any child is tragic, but it is doubly so when it could have easily been prevented through vaccination. If you would like to learn more about the ravages induced on innocent children by the anti-vaccination movement, please see our discussion entitled, Small Decision, Large Impact: Why Not Vaccinating Your Child Is Dangerous or Individuals Who Have Suffered or Died Because They Were Not Vaccinated.
We need to make one more point before we finish this discussion. Anti-vaccination advocates are adept at coloring the facts to suit their agenda (see, for example, Anti-Vaccination Advocates Use Statistics to Lie). Often, anti- vaccination advocates quote death rates from disease and state that the death rates due to diseases like pertussis were declining long before the vaccine was introduced, and this shows that the vaccine is not necessary in combating the disease. However, as is typical, the anti-vaccine advocates who make such statements are either showing their ignorance of medicine or willfully lying.
Even a first-year medical student knows that you cannot track a disease with its death rate. This is because modern medicine learns how to treat the symptoms of a disease before it learns how to treat the disease itself. As a result, the death rate from a disease regularly decreases once the disease has been characterized, even though the number of people catching the disease is constant or increasing. You can see that from the left-hand figure above. From 1940 to 1953, the average pertussis rate in the UK stayed rather steady, while the death rate dropped quickly. This is simply because doctors were treating the symptoms of the disease well, allowing those who contracted it to live longer.
To properly track the prevalence of a disease, then, you must look at the disease rate, not the death rate. This is important for two reasons. First, the disease rate tells you the prevalence of the disease itself, and it is not affected by the ability of doctors to treat the symptoms of the disease. Second, by monitoring only the death rate, you are ignoring the devastating long-term health consequences (deafness, blindness, paralysis, etc.) that accompanies many cases of childhood disease. Many of those who actually survive diseases such as pertussis are faced with a life-long disability that resulted from contracting the disease. These children are not accounted for in a study of the death rate. Thus, the disease rate is the important indicator when tracking the prevalence of a disease, and as the data clearly show, when the vaccination rate increases, the disease rate decreases, and when the vaccination rate decreases, the disease rate increases!
The bottom line is quite simple: Whether you look at disease rates over time or detailed, controlled, scientific studies, vaccines are incredibly effective at preventing disease. There is just no other way to explain the data.
References
1. Lewis Thomas, The Lives of a Cell: Notes of a Biology Watcher, New York: Viking Press, 1974, pp. 34-35.
2. Morbidity and Mortality Weekly Report, Volume 42:#53 (1994),pp.83-88; Volume 50:#53 (2003), p. 119
3. Francis Jr T, et al. “An evaluation of the 1954 poliomyelitis vaccine trials: summary report.” Am J Public Health 1955; 45(suppl): 1-50.
4. Hileman, B. “Risk Assessment in Medical Innovation.” Chemical and Engineering News, May 5, 2003;29-34
5. Feikin DR, et al. “Individual and Community Risks of Measles and Pertussis Associated with Person Exemptions to Immunization.” JAMA, 2000; 284:3145-3150.
6. Salmon DA, et al. “Health Consequences of Religious and Philosophical Exemptions From Immunization Laws: Individual and Societal Risk of Measles.” JAMA, 1999; 282:47-53
7. Belshe RB, et al. “The efficacy of live attenuated, cold-adapted, trivalent, intranasal influenzavirus vaccine in children.” N Engl J Med., 1998; 338(20):1405-12.
8. Belshe RB, et al. “Safety, efficacy and effectiveness of the influenza virus vaccine, trivalent, types A and B, live, cold-adapted (CAIV-T) in healthy children and healthy adults.” Vaccine, 2001;19(17-19):2221-6.
9. Vu T, Farish S, Jenkins M, Kelly H. “A meta-analysis of effectiveness of influenza vaccine in persons aged 65 years and over living in the community.” Vaccine, 2002;20(13-14):1831-6.
10. Data from the Public Health Laboratory Service Communicable Diseases Surveillance Centre, 61 Colindale Avenue, London NW9 5DF.
11. Hoffman H.J., et al. “Diphtheria-tetanus-pertussis immunization and sudden infant death: results of the National Institute of Child Health and Human Development Cooperative Epidemiological Study of Sudden Infant Death Syndrome risk factors” Pediatrics 1987;79(4):598-611
12. Walker, A.M., et al. “Diphtheria-tetanus-pertussis immunization and sudden infant death syndrome” Am. J. Public Health 1987;77:945-951
13. Essery S.D., et al. “The protective effect of immunisation against diphtheria, pertussis and tetanus (DPT) in relation to sudden infant death syndrome” Am. J. Public Health 1999;25:183-92
Dr. Wile and Erica A. Sommerville are not medical doctors. Dr. Wile is a nuclear chemist, and Miss Sommerville is a college student. As a result, they do not dispense medical advice. They simply educate the public about scientific issues. Please consult a board-certified medical doctor before making any medical decisions for yourself or your family.