Total U.S. Deaths Over The Past 7 Years and COVID-19

Over the past few weeks, I have gotten some emails regarding COVID-19 that were filled with misinformation. In an attempt to clear up this misinformation, I thought I would look at some data that are rather easy to obtain and analyze: total deaths in the U.S. over the past seven years and the deaths attributed to COVID-19. They come from the CDC, which I know many of my readers don’t trust. Indeed, I don’t trust the CDC when it comes to many of their recommendations, including some related to COVID-19. Nevertheless, these data are rather hard to manipulate, since they come from many independent sources. Thus, while they might not be 100% accurate, the overall conclusions we can draw from them should be reliable.

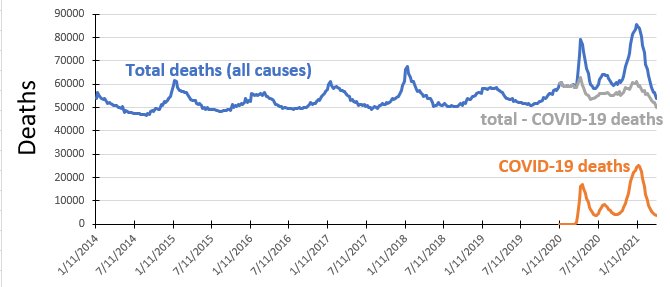
Looking at the above graph, then, what do we see? Let’s start with the total deaths (in blue). They follow a familiar pattern in the five years leading up to 2020. They peak in January, trail off in the summer, and start rising again in autumn. The peaks are generally attributed to two things: cold weather is more deadly than warm weather, and the influenza season typically peaks in January/February. Indeed, if you look at the heights of the peaks in the years before 2020, you can see when the more severe influenza seasons were: 2015 and 2018.

Notice, however, that 2020 and 2021 break the pattern established in the previous years. The peak in 2020 is much, much higher than the peaks in the previous years, and it comes later in the year (mid-April). In addition, when it comes back down to its minimum (late June), it is much, much higher than the minimum of any other year. Then, there is a bump that occurs later in the year, followed by another peak that is even higher than the one in April of 2020. Clearly, this tells us something unusual happened in 2020, and it is still happening in 2021.

Of course, we know what that unusual situation is: COVID-19. If we graph just the deaths attributed to COVID-19 (in orange), you see the same unusual pattern: a peak that occurs in April of 2020, another bump, and then an even larger peak. Just to see how much of this unusual pattern can be attributed to the COVID-19 deaths, the gray line shows you what happens when you take the total deaths and subtract the COVID-19 deaths. The result is something that looks a lot more like the pattern that was established in the past seven years. However, the pattern isn’t exactly the same as what is seen in the previous years. Notice that the gray line never gets as low as the blue line does in 2014-2019. Thus, even after subtracting out the COVID-19 deaths, there are still more deaths than in the previous years.

What does all this mean? Well, let’s start with two things we can say for certain. First, contrary to what you may have heard (and what I was sent in email), COVID-19 is NOT just a severe flu-like disease. It is responsible for more deaths than any flu in the past seven years. Indeed, the only influenza that was more deadly than COVID-19 in the U.S. (as of right now, anyway) was the 1918 Spanish flu. Second, COVID-19 deaths are not being significantly over-reported. If that were the case, subtracting out the COVID-19 deaths would have resulted in fewer deaths than in previous years (the gray line would have dipped lower than the blue line dips in previous years).

What can we say about the fact that even after subtracting out the COVID-19 deaths, there are still more deaths in 2020 and 2021 than the previous years? As I see it, there are two possibilities. It’s possible that COVID-19 deaths are being under-reported. It’s also possible that the COVID-19 measures that have been instituted have produced some deaths as well. I think the second option is more likely. Social isolation, delaying doctor appointments, etc., will result in more deaths. However, the number of those deaths is small compared to the COVID-19 deaths.

There is one more thing that I see in the data, but it is preliminary at best. Notice that the peak occurred much sooner this year than last. While the peak number of deaths in 2020 occurred in April, this year’s peak occurred in January. Assuming the virus hasn’t changed substantially over the past year, that means something happened to curtail COVID-19 deaths. What happened between 2020 and 2021? The vaccine started rolling out. The first doses were given in December of 2020, and the initial focus was on health care providers and those who are most at risk of dying from COVID-19. To me, it isn’t surprising that this produced enough of a slowdown in COVID-19 to cut the peak back three months. Once again, that is a preliminary conclusion which could be wrong. However, I do think that time will bear it out to be true. Regardless, I will post a similar analysis in a few months to see what the data say then.

Discovering Design With Earth Science

My latest book has been sent to the printer, and it should be ready in June. To learn more about it, you can go to my publisher’s website. In addition to the course description, you can click on “Product Resources” to get the table of contents, the entire first chapter, a list of the experiment supplies, an overview of the experiments, and a scope and sequence for the course. You can also get on the waiting list so that you are notified as soon as it is ready.

I have already posted a couple of excerpts from the book, but I thought I would give you one more. This comes from the introduction:

You have lived on the earth all your life, but you probably don’t know very much about it. As a child, you probably enjoyed digging in the dirt. But what is dirt? How is it different from rocks? How are rocks different from fossils and gems, which are usually found in rocks? You have sometimes enjoyed the weather and sometimes complained about it. But what makes the different kinds of weather you have experienced? You generally get up after the sun rises, and you have probably gazed at the stars after the sun has set. But what makes the sun rise and set? What are the stars? You will find the answers to these questions through a study of earth science, which is what I will cover in this book.

The earth is a marvel of design and complexity, because God made it. Psalm 24:1 tells us, “The earth is the Lord’s, and all it contains, The world, and those who dwell in it.” Psalm 111:2 also tells us, “Great are the works of the Lord; They are studied by all who delight in them.” I am sure that there have been times you have been delighted by the earth. I know that every time I sit on a beach or scuba dive in the ocean, I am delighted. The same thing happens when I gaze at a beautiful mountain or see constellations of stars in the night sky. Because I have been so delighted by the earth, I want to study it. I hope that this course makes you take even more delight in this planet that you call home, and I hope that it encourages you to continue studying the earth, even once you are finished with this book.

Why Do Creationists Use the Bible for Science?

Matthew Fontaine Maury, who was inspired by the Bible to map ocean currents.
This blog has been more quiet than usual, because I am trying to put the finishing touches on my new book, Discovering Design with Earth Science. As soon as that job is complete, you will be able to see preview materials at my publisher’s website. I decided to pause for a moment, however, because I was recently asked the following question by a frustrated atheist:

Why would you even think of using the Bible for science? It isn’t a scientific book!

It turns out that Discovering Design with Earth Science has two answers to that question. I shared them with him, and I thought I would share them with you as well. In the book, I present both sides of the age-of-the-earth issue in as unbiased a way as possible. I start with the uniformitarian view, which requires a very old earth. I then present the young-earth creationist view. The first answer to the atheist’s question is found at the beginning of that discussion:

Suppose you are examining the ruins of an ancient city and want to learn as much as you can about when it was built, how it was built, and how it fell into ruin. You see some of the remains of buildings, streets, walls, etc., but nothing has been preserved intact. You can learn a lot by investigating the ruins, but your conclusions will be based on your interpretation of what you see. Now suppose you found out that there was a book written shortly after the city was built, and it discusses the politics of the city for several centuries. While the focus of the book is on the government, it does cover many aspects of how and when the city was built.

Would you completely ignore the book and just examine the ruins, relying on your own interpretation to determine the city’s history? Of course not! If you wanted to learn the truth about the city’s history, you would read the book and let it help you interpret the ruins that you are investigating. This is how young-earth-creationists (YECs) study the geological record. They believe they have a book (the Bible) that comes from the Creator Himself. While the book focuses on more important things like salvation, morality, and our duties to God, it does discuss the creation of the universe, the earth, the organisms that lived on earth, etc. Since YECs consider the Bible to be an accurate source of history, they use it as a guide to studying the “ruins” of the geological column and fossil record. There’s a lot more to the history of the earth than what is in the Bible, but at least the Bible gives YECs a starting point to help their interpretation of the geological record.

The second answer to the atheist’s question comes from my discussion of the surface currents found in the ocean. While others had mapped some of those currents (Ben Franklin, for example, mapped the Gulf Stream), the man most responsible for mapping the ocean’s surface currents was Matthew Fontaine Maury, who is pictured above. He was inspired to search for the “paths of the seas” that are mentioned in Psalm 8:8, and after an exhaustive research effort, he ended up producing a detailed map of those currents. This revolutionized ocean travel, so he became quite famous in his time. He ended up writing a very important text on oceanography (what they called “physical geography” back then): The Physical Geography of the Sea. In that book, he references the Bible several times. In my earth science book, I tell the students all of this and then I add:

Many scientists didn’t like that and tried to discourage him from connecting the Bible to science. In a speech given at the founding of The University of the South, he gave those scientists a stern rebuke:

I have been blamed by men of science, both in this country and in England, for quoting the Bible in confirmation of the doctrines of physical geography. The Bible, they say, was not written for scientific purposes, and is therefore of no authority in matters of science. I beg pardon! The Bible is authority for everything it touches.
(Diana Fontaine Corbin, A Life of Matthew Fontaine Maury, Samson, Lowe, et. al., 1888, p. 192)

Young-earth creationists like me really believe that. The Bible is an authority when it comes to all the important things of life: salvation, morality, our duties to God, etc. However, because it was written by the Creator Himself, we believe it is an authority in whatever it mentions, including science.