I was recently made aware of a 2010 analysis that was done by Baylor University’s Office of Institutional Research and Testing. It compared first-time Baylor freshman who were homeschool graduates to the rest of Baylor’s first-time freshman population over a period of four years. I think the results will be helpful to those who are wondering whether or not home education adequately prepares a student for the academic rigors of university.
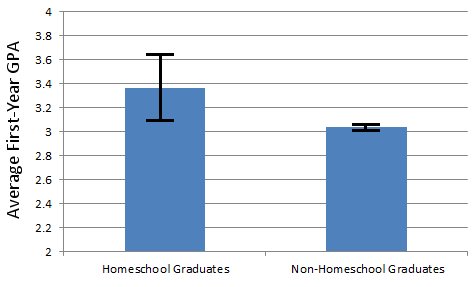
The first thing the analysis noted was that homeschool graduates had significantly higher SAT and ACT scores than the rest of the population. The homeschool graduates, for example, averaged 115 points higher on the SAT than the rest of the student population. While that is interesting, the really important result is how the homeschool graduates performed in their freshman year at Baylor. In the end, the average homeschool graduate had a freshman grade point average (GPA) of 3.364, while the average for the rest of the freshman class was 3.038. Here is a bar graph that illustrates this result:

The black bars on the graph are called error bars, and they demonstrate the possible error that exists in such a measurement. When you study a group of people, it is always possible that the people you have studied are not quite representative of the population you are trying to understand. As a result, whatever you measure might not be an accurate measurement of the population in general. Using statistics, it is helpful to estimate how much your measurement might be in error. The crudest way to do that is to use the size of the sample you are studying as a guide. The more people you study, the more accurate your representation of the population should be. In this analysis, they had a huge population of non-homeschool graduates (14,078) but a small population of homeschool graduates (151). As a result, the error associated with the homeschool graduates is large, while the error associated with the non-homeschool graduates is small.*
In general, the way you treat error bars is to assume that the measurement can actually be anywhere within the range of the error bar. For the homeschool graduates, then, the measured average was 3.364. However, based on the error bar, it could actually be anywhere from 3.090 to 3.638. For the non-homeschool graduates, the measured average was 3.038, but it could actually be anywhere from 3.012 to 3.064. The important thing to note is that even if you take the lowest value for the homeschool graduates and the highest value for the non-homeschool graduates, the average for the homeschool graduates is still higher. This means the analysis provides strong evidence that the average homeschool graduate does better than the rest of the population during his or her freshman year at Baylor. While I find that interesting, I think a more detailed look at the data is even more interesting.
Continue reading “Homeschool Graduates Rock Baylor University”


