
My previous post discussed two studies that seem to indicate masks have little effect when it comes to stopping the spread of COVID-19. I had several Facebook commenters who disagreed with my interpretation of the studies, which is not surprising. One commenter linked a recent study promoted by the CDC, which makes the remarkable conclusion that in Kansas, counties that adopted a mask mandate saw a 6% decrease in new cases, while those that did not adopt the mandate saw a 100% increase. If true, that indicates masks have a strong effect when it comes to stopping the spread of COVID-19. After reading the study and doing my own analysis of the numbers, I have to say that unfortunately, it is not true.
Once again, let me preface this by saying that I am not anti-mask. I wear a mask whenever I am in public, and I did so even before my state made it mandatory. In addition, I am not telling people to stop wearing masks. As I said in my first post, any mask not made specifically for viruses will be pretty much worthless in protecting the wearer. However, a mask does reduce the number of water droplets that the wearer spews into the air, and since those droplets can contain viruses, it probably does protect the people around the wearer, albeit to a small extent. Thus, you should wear a mask. At the same time, however, you need to have a realistic idea of what kind of protection it provides. So far, the data say it offers only a little protection.
With that out of the way, let’s look at the study. It examined various counties in Kansas that adopted a mask mandate on July 3, 2020 and compared them to the other counties that did not adopt a mask mandate. It developed a seven-day rolling average of new COVID-19 cases for both sets of counties and compared the numbers before July 3 and After July 3. The graph (shown near the bottom of the study) shows that while the 7-day rolling average continued to climb for those counties that did not adopt a mask mandate, it fell a bit for those counties that did. Thus, the mask mandate actually reduced COVID-19 cases, while lack of a mandate resulted in a steady increase in cases.
When I initially read this study, I had to admit that I was very skeptical for a couple of reasons. First, if you look at the graph, there was a huge drop in cases in the mask-mandate counties just 4 days after the mandate was adopted. Given the fact that there is a delay between infection and positive test, it’s clear that at least that part of the drop had nothing to do with the mask mandate. Also, I was very surprised that the data stopped after just nine weeks. Because of the incubation period of the virus and the time it takes to do a test, any effect of a policy will take a long time to be realized. Nine weeks seems like a very short time. Thus, I decided to use the same source used by the study to take a direct look at the data. When I did that, I saw that the study’s conclusion is just an artifact of the way the analysis was conducted.
Rather than manipulating the data by taking rolling averages, I simply graphed the number of cases seen each day. Also, I am specifically interested in the difference between the populations after the mask mandate went into effect. Below, you see the results from the day after the mask mandate started (7/4/2020) to the day the study ended (8/23/2020). The graph entitled “Kansas Mask Mandate Counties” contains data from the mask-mandated counties that are listed in the study (second note under the graph). There were three counties (Cowley, Pottawatomie, and Riley) in which a mask mandate existed in a city but not the county as a whole. Those are not included either graph. The remaining counties are the ones that make up my “Kansas No Mask Mandate” counties.
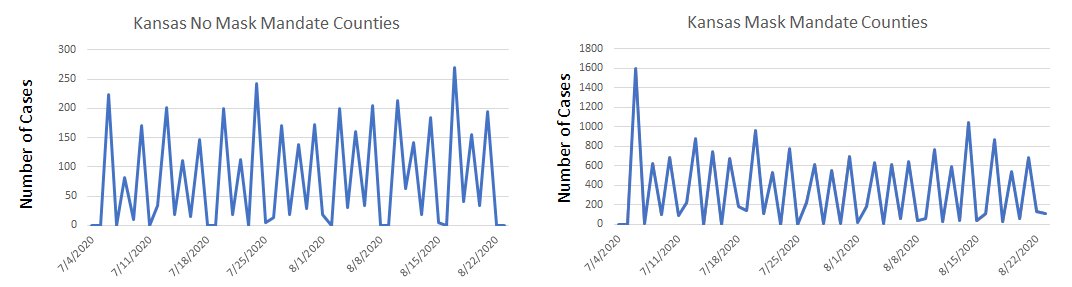
Notice that there is really little difference between the two. In general, COVID-19 cases bounce up and down, but they both stay rather constant throughout the entire length of the study. Statistically, there is a slight decrease in cases in the mask-mandate counties, but that is mostly because of the large spike at the beginning of the graph, which cannot have anything to do with the mask mandate. It is simply too soon after the mandate took effect.
Why does the study show such a marked difference between the counties? Mostly, it’s because of the fact that very little time is considered in the study. The number of infections were pretty small, and the data are spiky. As a result, there is a lot of statistical error in the analysis. You can see this by looking at the study’s 95% confidence intervals, as listed below the figure. The best the data can say is that after the mandate went into effect, the mask-mandate counties decreased by somewhere between 0.14 and 0.03 cases per 100,00 per day, while the no-mask-mandate counties increased by 0.01 to 0.21 cases per 100,000 per day. That means the statistical error is close to 100%! When your statistical error is that large, you really can’t make any definitive conclusions about what the data are saying.
There are two more reasonable ways to look at the data. First, we can look at the cumulative number of cases reported each day. That’s shown below:
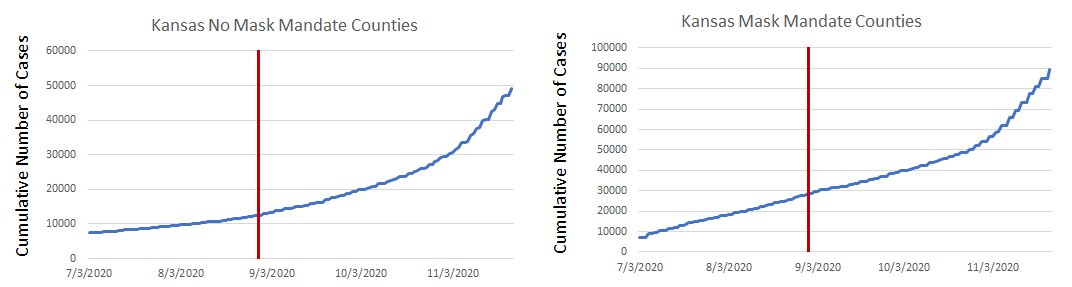
In this case, the time the study ends is given by the red line. For these graphs, the number of new infections per day is given by the slope. Notice that for the mask-mandate counties, the graph is a straight line during the course of the study. Thus, the infection rate did not drop. It stayed constant, as the slope of a straight line is constant. For the no-mask-mandate counties, the graph curves upwards slightly during the course of the study. Thus, the infection rate increased slightly in those counties during the course of the study. Notice, however, that since late October, both sets of counties are seeing an increase in infection rates, since both graphs are curved upwards.
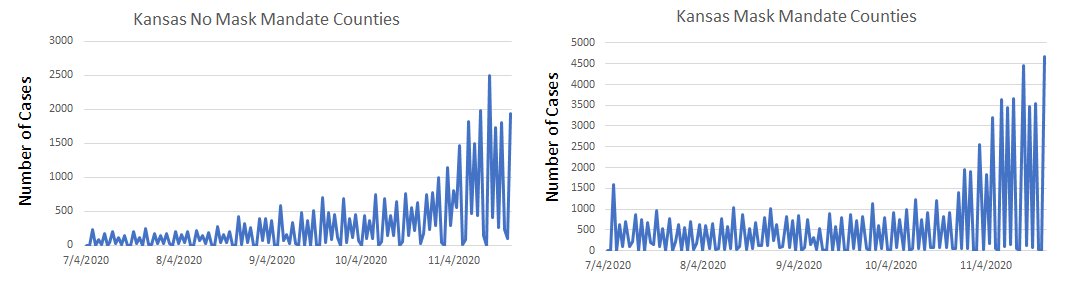
We can also look at the new infections each day, which is shown in the two graphs at the top of this post. Once again, they show essentially the same thing: the mask-mandate counties initially saw a constant rate of infection after the mandate, while the no-mask mandate counties initially saw a slightly increasing infection rate. Now, both sets of counties are seeing increasing infection rates.
So do these data indicate there is a difference between how COVID-19 spread through the counties over the time period of the study? Yes. It shows that the mask-mandated counties had a slightly slower spread of COVID-19 than the non-mask mandated counties. However, as is consistent with the data I discussed in my previous post, the effect is small. Once again, then, masks do seem to have an effect on slowing the spread of COVID-19, but that effect is small. Anyone who is counting on masks to significantly reduce the spread of the disease is not looking at the data.
Hi Dr Wile,
What about these 5 studies listed on the CDC website (the hair stylists, the Bejing one etc) – wouldn’t they conclude the “somewhat” effectiveness of masks????
Well, the issue is relevancy to the mask mandate. Yes, in close-contact situations, masks might be more effective. In communities interactions, the data say that the effect exists, but it is small.
Might it not have more to do with how people spend their time with those they deem in their close contacts. Most people I know go mask-less with those they “trust”. Masks seem to be working at smaller Christian colleges where the students are largely compliant.
Ya know, having a mandate and complying with that mandate are two different things. Many stores in my area have signs saying you must wear a mask to enter, but half the people don’t and the store does not seem to care.
Mask seems to help more if the diseased person is wearing one, but if you are asymptomatic, you don’t know that you need one. The mask will keep the cough, sneeze and sputter mostly in the mask, even if it helps a little would still be preferable to not wearing one. It might be a hassel to wear one, but, again, it would be preferable to risk infecting a grandparent.
Mandates are useless if not enforced.
I wonder if the reason this mask mandate showed only a small effect is that different types of non-surgical masks differ in effectiveness. According to a Duke University study, not all masks are equally effective at blocking respiratory droplets. However, any type of mask is usually allowable during a mask mandate, including less effective masks such as neck gators and bandanas. So in any given population under a mask mandate, there will likely be many people wearing these ineffective masks and many people wearing the more effective masks. Thus, even though there may not be a significant overall effect on lowering infection, it is still possible that some masks are effective. Do you think this hypothesis is reasonable?
It’s actually the most probable explanation. It also helps us understand why masks in certain situations seem more effective. Most likely, the situations in which they are the most effective is when the right types of masks are being used, and the people using them are using them properly.