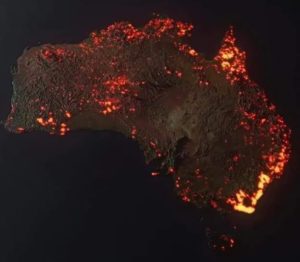
One case in point comes from the Australian bushfires that are wreaking havoc throughout the country. My Facebook feed recently showed me the image you see on the left. The person posting wanted to make me aware of how devastating the bushfires in Australia have become, so he posted this picture. While it does indicate an incredible level of devastation, it isn’t really true. There are two problems with the image. First, it looks like a satellite photo that is showing the fires burning right now, but it is not. It is an image that was developed on a computer, and it doesn’t show how Australia is burning right now or at any other time in the past. Each “flame” in the image represents a fire that burned sometime this season. In other words, it shows any region of Australia that had a fire this season, but it shows that region as on fire right now. In fact, many of the fires depicted on this image have been extinguished.
There is a bigger problem that is common with all visualizations of this kind. When you make an image like this, you need to add “fire” in the region where there is or was a fire. However, the image represents something very, very large. Suppose there was a fire that burned three square miles. That’s a big fire, but in this image, it would be represented by a red dot that is one millionth the size of the image. Thus, it wouldn’t show up. In order to make it show up, you need to make it bigger. However, that makes it look like more than three square miles were burned.
This issue is called “gridding.” When dealing with a large object, it must be partitioned into small sections by drawing a grid. If the sections in your grid are very large compared to the areas that you are depicting, the resulting depiction is deceptive. So, in fact, even considering all the fires that have happened so far this season (extinguished or not), they haven’t covered as much of Australia as the “flames” on this map.
Now don’t get me wrong. I am not saying that the fires in Australia are nothing to be worried about. They most certainly are devastating! They probably represent the worst bushfires in the past hundred or so years. That’s a bit hard to tell, because some of the most devastating fires in Australia occurred in the past, when news coverage wasn’t very good. We know, for example, that in 1851 widespread bushfires killed at least 12. In 1939, bushfires killed at least 71. While it does look like the current bushfires are burning a larger area than any of the previous ones, it is hard to say that with certainty. Regardless, the image above definitely overstates their severity.
The other thing that has to be said is that these bushfires are not the result of “climate change,” AKA global warming. In fact, we know that many of them are the result of arson. Since November, 24 people have been arrested in Australia for deliberately starting fires. In addition, another 183 are facing legal action because they did not obey fire-related laws, which might have led to even more fires. Thus, while it is popular to blame “climate change” AKA global warming for these fires, irresponsible and/or evil people are at least partially to blame. In addition, bushfires like these have been around long before carbon dioxide levels were rising in the atmosphere.
But wait a minute. These fires are spreading so quickly because there is a severe drought in Australia. Couldn’t the drought be caused by “climate change,” AKA global warming? Not based on the data we have right now. In 2017, a report on global droughts was published by the NOAA. The following graph, which depicts the percent of the globe that experienced drought each year, comes from that report:
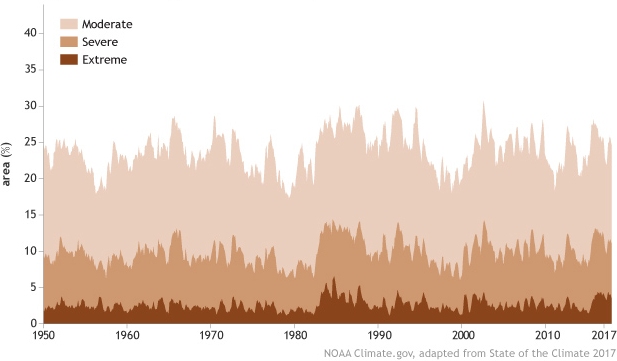
Notice that the percent of the globe that has been in any level of drought shows little (if any) trend since 1950. If “climate change,” AKA global warming were producing more droughts or increasing the severity of droughts, it should show up in a graph like this. It does not.
Once again, I am not downplaying the devastation that is occurring in Australia. In fact, I have donated to the relief effort, and if you feel led, you should as well.
I appreciate what you say about the image and how it misrepresents the Austrailian fires, but I think you are misrepresenting what people actually mean when they say that “Climate Change” caused these fires.
When anyone about climate causing fires, either “world-wide long term climate change” or just a particularly hot summer, they don’t mean that the climate “set” the fires. They mean they caused the conditions that made the fires particularly bad.
Whether fires were started by arson, careless human activity like dossing a cigarette out a car window, or naturally by lightning strikes, it’s the conditions on the ground that tell how bad that fire will turn out. In a wet year, they won’t be as bad, even if fires do start. In a hot dry year, or in windy conditions, or after a long drought (all of which CAN be tied to climate), fires set by any means can be much worse and much harder to put out. So saying that because some were started by Arson or careless human activities means they were not “caused by climate change” is sort of missing the point (though you did address that a little more later on in your article, you did it in a way that suggested its a separate issue, which it really isn’t). Sure, people are being inexact when they say that, but I’ve heard that sort of inexact language applied to the fires that often come during “El Nino” or “Santa Ana Winds” in California (a regular occurrence), and no one is assuming that the winds didn’t SET the blaze, just made the blaze spread quicker. I think people can understand that here too.
I do think I address that issue adequately in the post. I talk about how people think “climate change” AKA global warming is causing the severe drought, but it is not, as there is no significant trend in worldwide droughts.
Also, it should be noted that in 2018 there were 35,128 fires set by arson in the United States in 2018, so 25 instances of arson and a few hundred people breaking fire safety rules doesn’t necessarily represent a particularly large amount.
https://www.statista.com/statistics/252459/number-of-arson-offenses-in-the-united-states-by-type/
That’s not a reasonable comparison. Arson done in a city, for example, will not start a wildfire. It takes only one case of arson, not even 24, to start a huge fire if it is done in the right place.
i would like to know who says the truth! who shall I bekieve? what is a fact?
That has always been an important question. Throughout history, there have been people and groups telling you what the “truth” is, but most of the time, they aren’t telling you the truth, or at least not the whole truth. The best you can do is read from different sides and evaluate the evidence for yourself.
Other than the art and donation links all the posts are political and all the political brands are weighing in on it. A big issue that isn’t being discussed is Australia’s water management. We are letting mining companies, water bottlers and foreign owned farms have unlimited water without putting drought exception clauses into their contracts. Regarding the arson, a lot of the fires early in the season were deliberately lit which did start the fire season early but police and firefighters say none of the current fires are a result of arson.
I don’t agree that the graph “shows little (if any) trend since 1950”. What it appears to show is that the years after 1982 have been more drought prone than earlier years; but it also seems to show that the level of drought during each of those periods was fairly consistent. I have no idea why there was a step change around 1982.
I also wonder if increased drought in some areas has been offset by increased rainfall in other areas. Even in the driest year on record some parts of Australia got above average rainfall.
But a step up is not a trend. Since carbon dioxide in the atmosphere is trending up, you would expect any carbon-dioxide-caused issue to trend as well. 1982 was a particularly strong El Nino year, which might be the explanation for the step up. That, of course, is a completely natural cycle and has nothing to do with “climate change” AKA global warming. I am sure you are correct that when some areas are in drought, other areas might experience an increase in rainfall. In fact, most climate models predict that increased carbon dioxide will cause increased rainfall in areas far from the equator (like Australia) and decreased rainfall in areas near the equator. They predict that the net trend should be more rain, not less. This is further evidence that either this drought has nothing to do with “climate change” AKA global warming or we have no idea how to predict the effect of increased carbon dioxide. Most likely, it is both.
I read that Aboriginal Australians deliberately set smaller fires periodically throughout the land during dry seasons, so big fires like what’s happening now wouldn’t occur. I read about it at:
klc.org.au/indigenous-fire-management