
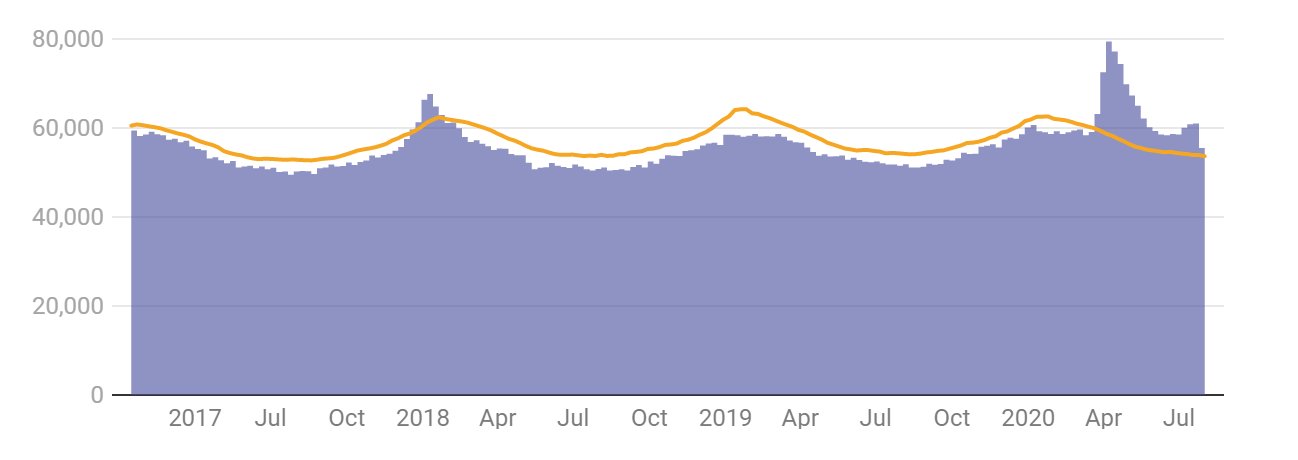
I have referenced this article in some comments I made previously, but I want to highlight it in a separate post, because the graph it contains (also shown above) makes it clear that the COVID-19 deaths are not some manipulation of the data. They are real. Very real. The purple bars in the graph represent all deaths recorded in the U.S. each week since 2017. The yellow line represents a projection of the maximum number of deaths that should have happened each week. The projection is based on historical data, and it fluctuates with the season. That’s because there are usually more deaths in the winter and fewer deaths in the summer, and as you can see, the actual deaths show that same fluctuation.
Notice that for most weeks, the actual deaths were lower than the maximum number of projected deaths. That’s expected. If the projection is done well, there should rarely be a time when the actual number of deaths meets or exceeds the maximum projection. However, there were some weeks in December of 2017 and January of 2018 when that happened, because there was a particularly virulent strain of the flu that season. As a result, more people died than were expected.
But those excess deaths are dwarfed by the ones that start showing up the last week of March in 2020. In that week, about 4,000 more than the maximum projected deaths occurred. Since then, the actual deaths have exceeded the maximum projected deaths by a considerable margin every week. All of this is discussed in the article from which I took the graph. However, I want to make a couple of additional points.
First, look at the shape of the excess deaths. There appear to be two peaks – one very large one the second week of April, and a smaller one at the end of July. This is important, because it looks very, very similar to the COVID-19 deaths reported over the same time span:
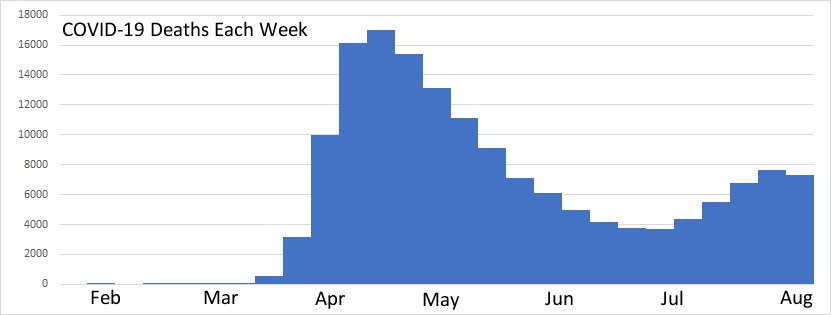
When the excess deaths have essentially the same time profile as the COVID-19 deaths, you know that the COVID-19 deaths make up most of the excess deaths. This tells us that the vast majority of COVID-19 deaths are real and most certainly represent people who would not have died had there not been the COVID-19 pandemic.
Second, some friends have asked me why they don’t know anyone who got the disease or died from it. After all, if there really have been more than 180,000 people who died from the disease and more than 6 million confirmed cases, shouldn’t everyone know someone who has suffered from it? Of course not! There are 328.2 million people who live in the U.S. That means about 2% of the population has contracted COVID-19, and about 0.05% have died from it. Thus, your chance of knowing someone who died from it is ridiculously low. While your chance of knowing someone who contracted it but didn’t die from it is significantly higher, remember that for most cases, the disease is mild. Thus, you would have to know someone well enough that you track his or her common illnesses to be aware that he or she had the disease!
It disturbs me that there are so many people (many of whom are Christians) who think this pandemic has been made up. The data clearly say that it hasn’t been. Lots of people died because of the disease, and misinformation will only increase the number of deaths. Now please understand that I am not saying that I support any of the measures that governments have taken to slow the spread. We don’t know enough about the disease or the consequences of the actions that have been taken to know whether or not they are a good idea. I said this before, and I will say it again:
As a scientist, let me assure you that no one really knows what we should be doing. There are a lot of experts saying a lot of different things, and you should listen to all of them. Then, you should decide what works best for you and your family, and you should start doing it. But once you decide what you and your family should be doing, please please please show grace to those who choose to do something different. Since the experts can’t agree on a proper course of action, there is no reason to expect your neighbor to agree with your course of action.
In addition to showing grace to others, please please please stop spreading the false idea that the COVID-19 deaths are few in number or not real at all. They are real, and there are a huge number of them. There is simply no other way to understand the data.
The pandemic is obviously real. I’ve also been tracking the number of deaths in the US from 2017 based on the same CDC data.
A related interesting question, however, is “what is the 2020 COVID-19 death rate by age group and how does it correlate to the total death rate by age group in the U.S.?”
02/01/2020 to 08/15/2020
United States
Age Group | Covid-19 | Total
0-24 | 0.3% | 2.5%
25-34 | 1.0% | 3.0%
35-44 | 2.8% | 4.2%
45-54 | 4.9% | 4.9%
55-64 | 11.1% | 11.0%
64-74 | 17.7% | 15.7%
75-84 | 19.6% | 17.2%
>85 | 42.7% | 41.5%
I would conclude Covid-19 really affects older people with a weakened immune system and/or pre-existing conditions. Keeping this in mind might have affected the political and economic response to the pandemic.
How so, given that the coronavirus spreads so easily through the population when social distancing and masks aren’t consistently and responsibly practiced? And those who are young and healthy can spread it without any symptoms while test availability has been scant and speed of results unhelpfully measured in days and weeks?
Yes, this could have been handled much better based on what we knew about it back in March and April. Yet it wasn’t, and there’s no explanation nor excuse for it other than a persistent lack of leadership and action at the national level on many fronts ranging from ramping up national testing capacity to consistent messaging about practices to standardization of measurement and reporting as a *minimum*.
States could only do so much on their own or in federation with each other. Hindsight wasn’t what was missing.
The issue isn’t that covid is not real but the way it’s been exploited in several different ways for a specific political agenda.
BTW, on the last article you published on the China virus you responded to my comment in which I did not exclude the possibility that the virus was in someway man made. You responded as if you were sure that wasn’t the case.
Well, I just saw today on Research Gate a paper that stated indeed that there is evidence of man made manipulation.
It seems to me, from the last two articles, that you tend to not want to see the evilness and planning of a lot of what’s happening to our country.
https://www.researchgate.net/publication/344153988_HIV_MAN-MANIPULATED_CORONAVIRUS_EVOLUTION_TRENDS
Actually, there are lots of people who argue that they aren’t real or aren’t numerous. Indeed, that’s what my previous post discussed.
We know that the assertions put forth in the article you linked are not correct. Here is a layman’s discussion of the data. Here is a more technical discussion. I am definitely prepared to believe in the evilness of people. However, I follow the data, and the data indicate that this is not a human-made virus.
My question is whether the COVID-19 deaths are inflated. I have heard of three cases (very close to source) of very clearly false reports, as in gunshot wound to the head was a COVID-19 death. Another was a woman who stood in line for a COVID-19 test. The line was too long and she went home before being tested. Her test results came in the mail as “positive.” If I know of three false reports, how many more are there!?! I am very aware that COVID-19 is real but don’t trust CDC reports.
But that’s why I am showing the graph. The data tell us that they can’t be too inflated. After all, there are about 200,000 excess deaths and 180,000+ COVID-19 cases. Also, the excess deaths follow the same time profile as the COVID-19 deaths. Thus, the vast majority of COVID-19 deaths are real and not the result of inflation.
Thank you for publishing information that is reasonable, data-driven, and filled with grace for differing opinions. That is exactly what our country lacks right now.
about 2% of the population has contracted COVID-19, and about 0.05% have died from it.
Are you assuming that only those who have tested positive have covid? I think 10% would probably be a better estimate.
I am only considering positive tests. I am sure there are people who had it and didn’t get tested, but I have no way of estimating how many people that is.
The death rates for Covid are severely inflated. What happened in 2018? Yes, excess deaths have occurred, but CDC has already stated that only 4% are directly due to Covid.
They cannot be inflated. The data clearly show that. After all, there are about 200,000 excess deaths and 180,000+ COVID-19 cases. Also, the excess deaths follow the same time profile as the COVID-19 deaths. Thus, the vast majority of COVID-19 deaths are real and not the result of inflation. The percentage of people who die with only COVID-19 listed as the cause of death is not relevant, as I explain in this post.
Is it possible to know if a death was due to having COVID? There were many unable or unwilling to get treatment for their health problems.
The death certificate contains the physicians’ best judgement on what caused the death. I am sure that not every death listed is actually due to COVID-19, but there are also COVID-19 deaths that are missed. The data indicate that the numbers quoted are reasonable, however, since the number of COVID-19 deaths are roughly the same as the number of excess deaths, and the time profile of the excess deaths is the same as the COVID-19 deaths.
The CDC did not say “only 4% are directly due to Covid”. You’re quoting a figure that counts death certificates listing ONLY COVID-19, and that incorrect interpretation has been widely shared. Here’s what their current report states: “For 6% of the deaths [involving COVID-19], COVID-19 was the only cause mentioned.”
That 6% doesn’t mean there weren’t other comorbidities in those cases nor even that there weren’t comorbidities: it just means for whatever reason, that’s the only reason listed on the death certificate.
https://www.cdc.gov/nchs/nvss/vsrr/covid_weekly/index.htm
How many people has the coronavirus killed? https://www.nature.com/articles/d41586-020-02497-w
25% + of excess death in US are not attributed to Covid but to the lock-down including increases in heart disease, diabetes, and asthma deaths. #coviddeaths
25% seems high based on the CDC data, but that still means the vast majority of excess deaths are COVID-19 deaths. Of course, that is clear from the time profile of the excess deaths, which fits the time profile of COVID-19 deaths.
Might you write an article speaking to the effectiveness of tried and proven treatments and prophylactics? Perhaps you don’t believe the stats regarding the highly effective treatments and the high recovery rate? It also would be nice to see you promote the amazing attributes of our body and its defense mechanisms and the intricate immune systems. I am surprised that you have agreed to perpetuate fear. I’m so saddened and disappointed because I love your science curriculum, thoroughly. Although, you might have written an article regarding the upside of the situation, and I missed it?
I am not sure what you mean by “perpetuate fear.” I am simply discussing what the data say. If you look through my previous posts, you will see that I have written about several prophylactics and treatments. In all cases, I simply communicate what the data indicate.
First, Dr. Wile, I’d like to say that I’ve been a great respecter of yours for several years, after I first heard you give a talk.
All the same, I do not yet agree with your conclusions on this subject. I think in this tense atmosphere, it would be good for everyone, myself included, to gather information and to hear arguments on both sides. You and I stand on opposite sides of the fence at the moment, but I think we’re both willing to hear each other.
I’d like to suggest that the excess all-cause deaths shown in your graphs might not be attributable to SARS-CoV-2. We are living in the most stressful, the most fearful, the most hateful, the most uncertain time that I have ever witnessed. And I’m not just talking about the virus. I’m talking about the *panic* surrounding the virus, panic that is being drummed into us, and the draconian measures being imposed on ordinary citizens like house arrest, and the Orwellian censorship I’ve seen from tech companies, and fascist hotlines for reporting dissidents, and the rioting and destruction happening across the country. If you had all of this without SARS-CoV-2, I suspect you’d see significant excess deaths.
Dr. Denis Rancourt published an interpretation of the all-cause deaths a few months ago, corresponding to the first spike in your graph: “All-cause mortality during COVID-19: No plague and a likely signature of mass homicide by government response.” (https://activistteacher.blogspot.com/2020/07/links-to-denis-rancourt-articles-and.html) You can read the abstract to see his main arguments.
I’d also like to mention my skepticism toward the data itself. No matter where data comes from, I always have a bit of skepticism toward it. Conclusions can only be as good as the data, so I need to be careful about what data I trust. In this case the source of the data is the CDC. That makes me even more skeptical.
Tony Heller has been pretty good at exposing data fabrication in the area of climate science. (One of his recent videos is a good example: https://realclimatescience.com/2020/09/new-video-erasing-the-record-heat-of-1913/) And his work has lead me to realize that for some government officials, fabricating data is not unthinkable. Add in the flagrant conflicts of interest between some government officials and the pharmaceutical industry that stands to make a profit (Robert F. Kennedy, Jr. is a good spokesperson to understand this), and I find myself in a situation where there is nothing from the CDC that I can trust.
To be clear, I’m not saying the data is false. I’m just saying that by itself I don’t trust it.
Bobby, I have looked at all sides of this issue. Like you, I am certainly willing to believe that the government behaves nefariously. In addition, I have a lot of readers who are not inclined to accept the prevailing narrative. They have sent me all sorts of information (including Dr. Rancourt’s work). However, none of the information is consistent with the data, including the arguments presented by Dr. Rancourt. His analysis stops about the end of May, which as you can see from the graph in this post, is early on in the pandemic. He says that the time profile of cases and deaths doesn’t follow the pattern of a virus, but now that we have a lot more data, we can see that it clearly does. As I mention in the article, the excess deaths have a two-peak time distribution. Not only is this exactly what we expect for a virus, it is also the time profile of the COVID-19 deaths. Thus, there is no other way to interpret the data than to conclude that the COVID-19 deaths are the vast majority of the excess deaths.
Remember, the CDC only compiles the data. The death certificates are authored at the hospital. Also, developed countries around the world are all producing very consistent data. Yes, the government can easily make up data, but in this case, it would require several different governements (some which rarely cooperate with others) all working together in collusion with all the hospitals in their countries to force the data to look exactly the way it should look. That takes more faith than I can muster.
Thank you for sharing this helpful data. Now let’s all calm down and realize that God is in charge. Instead of hurling unsupported accusations around the Internet, let’s put our faith to work and pray for a timely end to this plague, while doing what we can to hasten the day.
Well said!
I truly appreciate the way you stated this in such an easy-to-understand way.
I saw an interesting statistic on James White’s Website: https://www.aomin.org/aoblog/personal/please-stop-with-the-6-story/
Multiple Conditions increase risk
1% of people with no risk factors died from Covid-19
25% with one condition
26% with two conditions
48% with 3 or more conditions
Conditions include: Active Cancer, Atrial fibrillation, COPD, Dementia, Diabetes, Heart Disease, Hypertension, Chronic Liver Disease, Chronic Renal Failure & Stroke
Study of 355 deaths from 16,952 confirmed cases in Italy.
Thanks, John. I had not seen that.