from http://en.wikipedia.org/wiki/File:Sun_projection_
with_spotting-scope.jpg
It seems simple enough. The sun warms our planet. Thus, if one is wondering what is happening to the temperature of our planet, one should look for changes that are occurring in the sun. Sure, there are a lot of other things one must investigate as well, but the sun should be a major priority, right?
Well, not according to the Intergovernmental Panel On Climate Change (IPCC). In their 2007 report,1 which claims that “Warming of the climate system is unequivocal” and that there is a “very high confidence that the net effect of human activities since 1750 has been one of warming,” they state:
Solar irradiance contributions to global average radiative forcing are considerably smaller than the contribution of increases in greenhouse gases over the industrial period.
So the IPCC says that the huge ball of thermonuclear reactions upon which the earth depends isn’t nearly as important when it comes to climate change as the relatively recent 35% increase in atmospheric carbon dioxide.
Fortunately, not everyone thinks the IPCC is serious about science. As a result, some climate researchers are actually trying to figure out how important changes in the sun’s activity are when it comes to the overall temperature of the earth. Not surprisingly, current research is showing that the conclusions of the IPCC are wrong.
C. de Jager and S. Duhau published a Short Communication in the Journal of Atmospheric and Solar-Terrestrial Physics in which they develop a relationship between the average temperature of earth’s Northern Hemisphere and the sun’s activity.2
They use two things to measure the sun’s activity. First, they use the observed number of sunspots. As odd as it may sound, the more sunspots there are, the brighter the sun actually is. Second, they use an index that measures the magnetic activity of the sun during times of minimal sunspots.
For the average temperature of the Northern Hemisphere, they refer to a study by Moberg and his colleagues.3 This study used tree rings and sediments from lakes and oceans as a measure of the average temperature in the Northern Hemisphere for the past 400 years. Now obviously the temperatures derived by such “proxy” methods are not amazingly reliable, but if you want long-term temperature data, you don’t have much choice. At least Moberg and his colleagues used many different proxies in hopes of getting a somewhat reliable measure for the average temperature of the Northern Hemisphere.
What Jager and Duhau show is that the Northern Hemisphere’s increase in temperature over the past 400 years is mirrored by both of their measurements for the sun’s activity. In other words, Moberg and his colleagues show that the average temperature of the Northern Hemisphere has been shakily but steadily increasing over the past 400 years, but so has the activity of the sun.
As a result, it is important to know what fraction of the Northern Hemisphere’s temperature increase comes from the increasing activity of the sun, and what fraction comes from other effects, such as rising levels of greenhouse gases. In order to determine this, Jager and Duhau develop an empirical relationship between the activity of the sun and the average temperature of the Northern Hemisphere. In determining this relationship, they specifically exclude temperatures after 1960 so that they do not end up “contaminating” their relationship with any recent effects, such as rising levels of carbon dioxide.
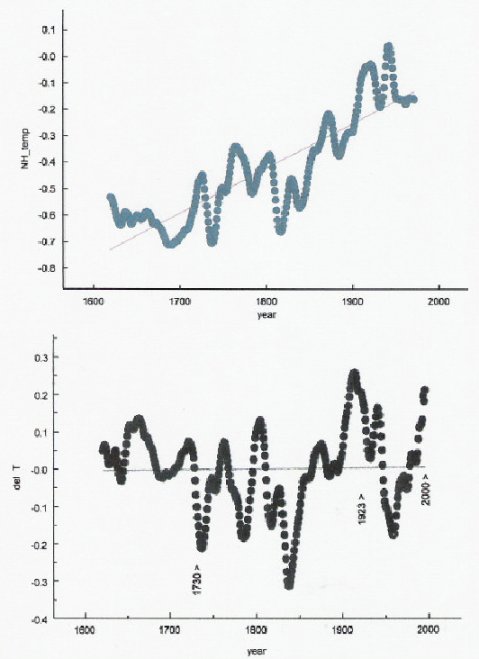
Once they determine the empirical relationship, they subtract it from the temperature data. They say that the resulting graph should represent Northern Hemisphere temperature changes that are due to everything except the sun. The results are below. The top graph shows the temperature data before the sun’s effects are subtracted. Note the shaky but steady rise. The bottom graph is what’s left once the sun’s effects are subtracted:

Note that once the sun’s effects are removed, the shaky but steady increase in temperature over the past 400 years is almost completely gone. Also, notice that the fluctuations in temperatures that are left indicate that the the recent changes in Northern Hemisphere temperature are not unusual. Indeed, the greatest warming unrelated to the sun’s activity occurred in the 1900s, long before carbon dioxide levels were increasing significantly.
Based on Jager and Duhau’s analysis, then, the IPCC is dead wrong. The sun’s effects are very important when looking at temperature changes, and once those are taken into account, what is happening now is not unusual and probably not the result of atmospheric carbon dioxide levels.
Now of course, we don’t know enough about the sun and climate to know whether or not Jager and Duhau’s analysis is accurate. Nevertheless, I think it is significantly more reasonable than anything coming out of the IPCC!
REFERENCES
1. IPCC Fourth Assessment Report: Climate Change 2007, available online
Return to Text
2. C. de Jager and S. Duhau, “Episodes of relative global warming,” Journal of Atmospheric and Solar-Terrestrial Physics 71:194-198, 2009 available online
Return to Text
3. Anders Moberg, et al., ” Highly variable Northern Hemisphere temperatures reconstructed from low- and high-resolution proxy data,” Nature 433:613-617, 2005 available online with subscription
Return to Text
