Do Rising Carbon Dioxide Levels Cause Warming or Vice-Versa?

Sometimes, it’s easy to determine cause and effect. Other times, it’s not! (click image for credit)
We know that carbon dioxide is a greenhouse gas. In other words, we know it absorbs infrared radiation coming from earth’s surface, warming the atmosphere. In fact, as far as we can tell, it’s what makes the earth warm enough to support life. It is thought that if there were not enough carbon dioxide in the earth’s atmosphere, the earth would radiate too much energy back into space, causing it to be far too cold for life to flourish here. Common sense, therefore, requires us to believe that when carbon dioxide levels rise in the atmosphere, the earth’s temperature will rise.

Unfortunately, science often does not follow common sense. I use quantum mechanics in my field of research all the time, and it violates common sense at every turn. Nevertheless, I am forced to use the theory because the data strongly support it. Thus, even though “it makes sense” that rising carbon dioxide levels will increase the earth’s temperature, we don’t know that for a fact. Indeed, the majority of the data have consistently shown that this is not the case. Several analyses of ice-core data show that on long time scales, the average temperature of the earth rises, and then carbon dioxide levels rise (see here, here, here, and here).

Now, of course, all these studies use proxies to estimate global temperature, and that can be tricky. In addition, producing the time scale involves making several unverifiable assumptions. Thus, I have never put much stock in such studies. However, others who are interested in climate change (aka Global Warming) take these data seriously. They generally say that these long-term trends are showing the effects of changes in earth’s orbital cycle, which changes the energy it gets from the sun. Thus, they aren’t relevant to what is happening right now. Also, there are at least some ice-core analyses that show carbon dioxide rising before temperature does. In other words, it’s complicated.

However, a recent study (which actually builds on two previous studies) looked at the modern data that has been collected for carbon dioxide levels in the atmosphere and global temperature. In other words, it analyzed what is happening right now. Of course, there are several sets of data for global temperatures, and they don’t really agree with one another, but the authors used a well-accepted one. What they found is that even on this relatively short time scale, carbon dioxide levels rise after temperatures rise. In fact, here are three graphs from the abstract:

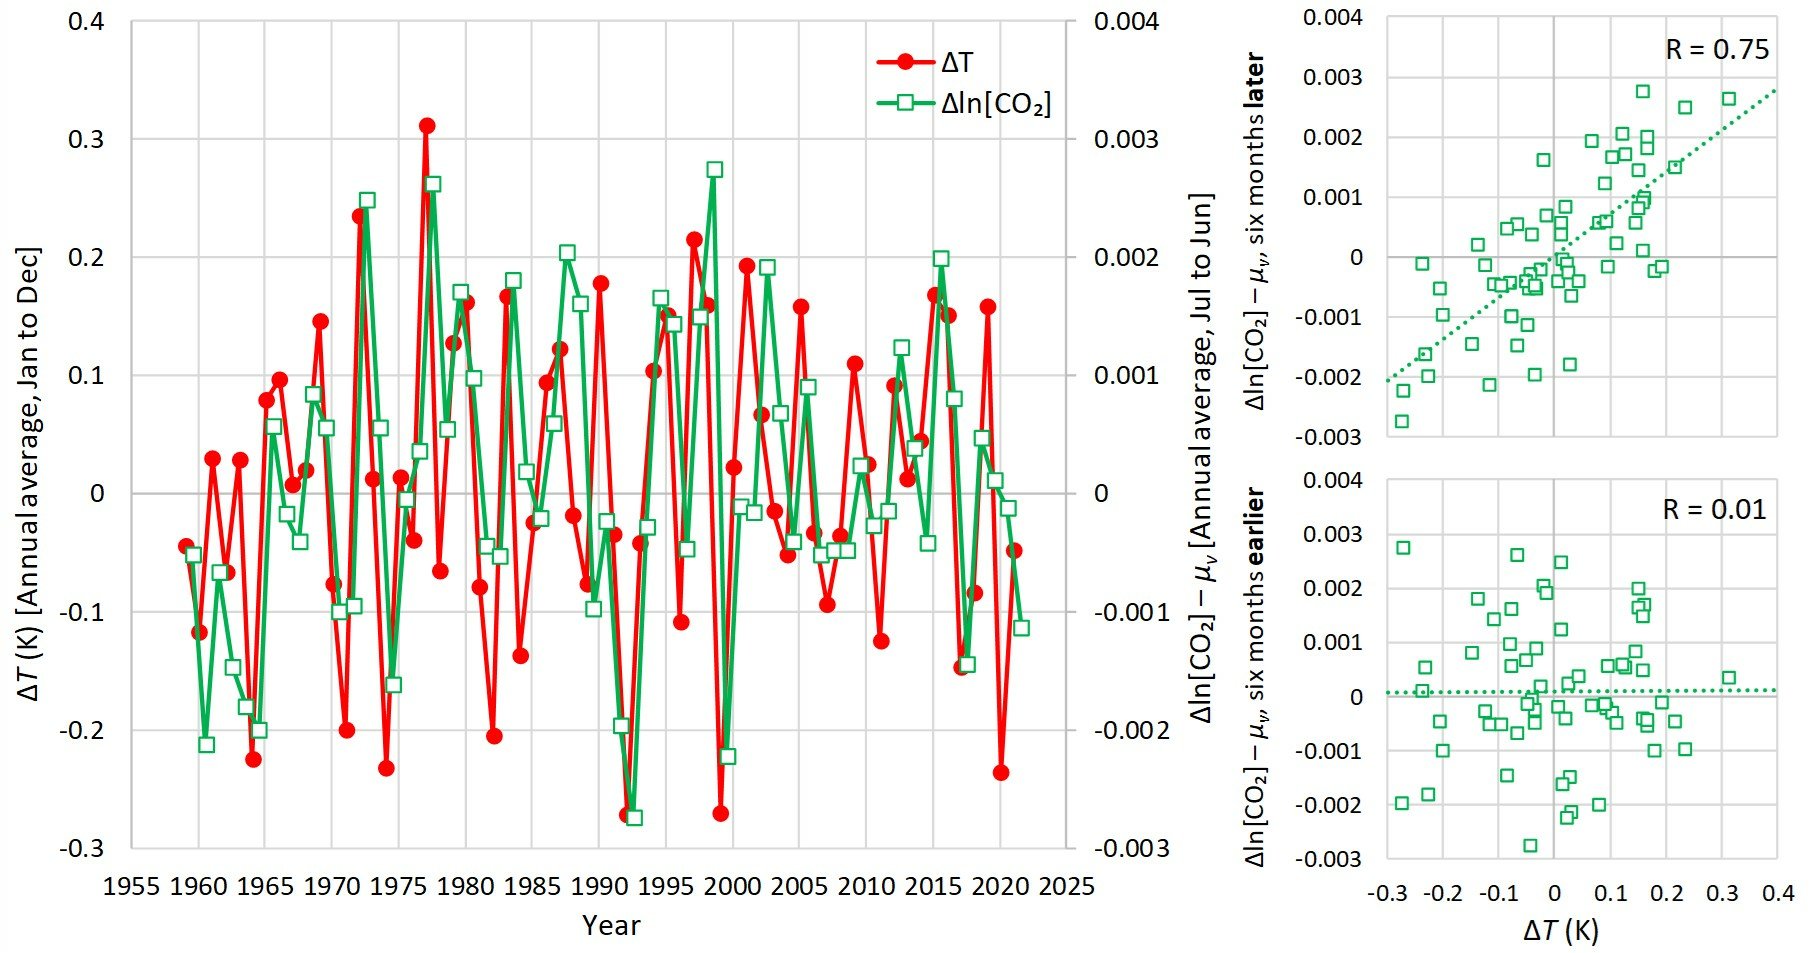
From the graph on the left, it is clear that temperature (red line) rises first, then carbon dioxide level (green line) rises. The other two graphs show this even more convincingly. On those two graphs, changes in carbon dioxide and temperature are only correlated with one another if you consider the change in carbon dioxide level after the change in temperature, not before.

But wait a minute. How can temperature affect carbon dioxide level? Well, one of the major places the earth stores carbon dioxide is in the ocean (and, to a lesser degree, in fresh water). When temperatures go up, carbon dioxide becomes less soluble, so the oceans release carbon dioxide. From that point of view, it “makes sense” that rising temperatures will cause rising carbon dioxide levels. But once again, science doesn’t always make sense. Thus, it’s probably very complicated. Most likely, rising temperatures cause rising carbon dioxide levels, and those rising carbon dioxide levels cause more rising temperatures.

Which is more important? If you trust this study, it’s the former. In their appendix, the authors estimate that the increase in atmospheric carbon dioxide levels caused by increasing temperature is three times greater than the increase in carbon dioxide levels caused by human emissions. Now, of course, that still means human emissions increase temperature. However, it also means that (not surprisingly) the global climate models aren’t properly taking this into account. As a result, global climate models are exaggerating humanity’s contribution to global warming. While I think that has already been well-established, this study gives at least one of the explanations for it.

To Believe the Climate Change Hype, You Must Ignore History

A 19th-century artist’s interpretation of New England’s “Dark Day,” which occurred on May 19, 1780.

There are many politicians and media figures (as well as a few scientists) who are desperately trying to convince us that global warming (aka “climate change”) is a dire problem that requires radical action right now. One of their most effective tools is to discuss a current event as if nothing like it has ever happened before. That way, they can blame it on climate change. This works, in part, because history education is so poor that most people don’t know what happened in the past.

Consider, for example, the terrible air quality in the New York City area recently. Vox reported on it with the headline, “Why some of the US has the most polluted air in the world right now.” It correctly blames the situation on wildfires in Canada, but then it says:

…this extreme fire event and its long-ranging smoke trail indicate a much larger and concerning trend: wildfires are getting worse, lasting longer, and occurring more frequently, primarily due to climate change.

Of course, none of that statement is even remotely true. According to satellite imagery, here is the area of land burned globally by forest fires each year since 1980:

Notice that there is no trend in the data. From a global perspective, wildfires haven’t changed in 40 years! This is backed up by the most comprehensive study on global wildfires, which states:

…many consider wildfire as an accelerating problem, with widely held perceptions both in the media and scientific papers of increasing fire occurrence, severity and resulting losses. However, important exceptions aside, the quantitative evidence available does not support these perceived overall trends. Instead, global area burned appears to have overall declined over past decades, and there is increasing evidence that there is less fire in the global landscape today than centuries ago.

But what about the air quality in New York? We’ve never seen anything like it before in the U.S., right? Wrong! Historically, the worst air quality recorded in the U.S. occurred on May 19, 1780 in the New England area. It’s referred to as New England’s Dark Day because the sky was so filled with smoke and fog that candles were required starting at about noon. What was the cause? It is impossible to know for sure, but the major contributor seems to be forest fires in the Algonquin Highlands of Ontario, Canada. As discussed in the link above, studies of tree rings in that area (as well as historical records) confirm that a major wildfire occurred there that year.

So while these things don’t happen often, they have happened in the past. Indeed, while one of these new fires might break it, the current record for the single worst forest fire in North America was the Chinchaga fire of 1950. In addition, the available data say that such events aren’t increasing in frequency or severity. Unfortunately, history and science education is incredibly poor these days, so most people just don’t know that. As a result, ignorant (or malicious) politicians and journalists (as well as some scientists) can prey on that lack of knowledge.

A Significantly Better Way to Address the Possibility of Global Warming

An illustration of carbon dioxide molecules (left) becoming ethylene molecules (right) by passing through an electrified grid in water. (Credit: Meenesh Singh, one of the study’s authors.)

If you have been reading this blog for a while, you know that I am very skeptical of the idea that global warming (aka climate change) is a serious problem. There are many scientific reasons for this, most notably the fact that we still have no real understanding of how increased carbon dioxide in the atmosphere affects global temperature. However, we do know that the amount of carbon dioxide in the air is increasing, and we also know that human activity is causing that increase. As a result, it is reasonable to try to do something about that, as long as we don’t kill people or a disproportionate number of animals in the process. The problem, of course, is that most of the proposed solutions for reducing humanity’s carbon dioxide emissions do both (see here, here, here, and here).

Rather than trying to replace efficient and inexpensive sources of energy with our current unreliable, expensive, and deadly “green” sources, we should work on developing technologies that reduce carbon dioxide emissions in a way that doesn’t affect energy price and availability. One example of this better approach can be found in a recently-published study that reports on a new method which can be used to convert carbon dioxide into ethylene, a chemical that is used in a wide range of industrial processes.

The most common method currently in use for producing ethylene is called “steam cracking,” and it is a high-temperature process that is estimated to produce 260 million tons of carbon dioxide each year. However, the process described in the study can be done at much lower temperatures. It involves passing an electric current through a chemical reaction vessel that contains carbon dioxide and a water-based solution. Hydrogen atoms from the water end up combining with carbon atoms from the carbon dioxide to produce ethylene. While such methods have been explored in the past, this method is significantly more efficient. In addition, if the electric current powering the cell is produced by solar or other renewable energy sources, the process actually uses up carbon dioxide. In other words, this process turns an activity that adds carbon dioxide to the atmosphere into an activity that pulls carbon dioxide from the atmosphere.

But wait a minute. If this process requires renewable energy sources to pull carbon dioxide out of the air, aren’t we just falling back on the old “green” technologies that cause so many problems in the first place? Not really. Two of the biggest problems with current “green” technologies are that they make energy more expensive and often cannot keep up with our energy demands. This process actually reduces cost significantly, because it doesn’t require so much heat. Thus, the higher expense of “green” technologies is offset by the lower cost of the process as a whole. Also, we don’t need to be making ethylene constantly. We can make lots of it when the “green” sources are producing energy, and we can wait when they aren’t. As a result, we are not harmed by their limitations.

In addition, scaling up this technology to make it useful for industrial purposes will probably lead to ideas of how similar processes can be used in other industrial applications. In my view, this kind of technology should be the focus of any proposed solutions for reducing humanity’s carbon footprint.

An Excellent Debate on Climate Change

The Soho forum recently held an Oxford-style debate on climate change between two experts on the matter. The resolution being debated was:

Climate science compels us to make large and rapid reductions in greenhouse gas emissions.

Arguing for the affirmative was Dr. Andrew Dessler, professor of geoscience at Texas A&M and director of the Texas Center for Climate Studies. Arguing for the negative was Dr. Steven Koonin, a professor of civil and urban engineering at NYU’s Tandon School of Engineering, who served as undersecretary for science at the Department of Energy during the Obama administration. You can watch it here:

You can watch it on YouTube by clicking here.

The debate was excellent, with both debaters showing why they are considered experts on the issue. However, Dr. Koonin was the clear winner, because the debate audience was asked to respond to the resolution both before and after the debate. Before the debate, 24.69% of those in attendance agreed with the resolution, while 48.77% disagreed. The rest were undecided. Thus, the audience was probably better educated on the issue than most of the public (and most politicians), since a plurality had the more scientifically-defensible reaction to the resolution. However, by the end, the “yes” votes had decreased by 5.56%, while the no votes increased by 24.69%.

Now, of course, you have to be the judge of why Dr. Koonin won the debate. For me, it was because his statements were backed up by data. I hope there are more debates like, because the better educated the public is on the science related to climate change, the more likely it will be for the world to enact sane measures to address it.

Another Failed Global Warming Prediction

A portion of the Great Barrier Reef (click for credit)

Climate change alarmists (aka global warming alarmists) are constantly making dire predictions, and over time, those predictions end up being falsified*. This doesn’t stop them from making even more dire predictions, however, since the media rarely point out how wrong they have been in the past. Usually, those dire predictions are found in the popular media, but since climate science has been infected with craziness, such nonsense even makes it into the the scientific literature.

Consider, for example, this 2012 study, which was published in the prestigious Proceedings of the National Academy of Sciences of the United States. The authors claim that their study shows coral in the Great Barrier Reef (GBR) had been declining for the past 27 years, and then they state:

Without significant changes to the rates of disturbance and coral growth, coral cover in the central and southern regions of the GBR is likely to decline to 5–10% by 2022. The future of the GBR therefore depends on decisive action. Although world governments continue to debate the need to cap greenhouse gas emissions, reducing the local and regional pressures is one way to strengthen the natural resilience of ecosystems.

So governments must act decisively to cut greenhouse gas emissions, or the GBR is going to dwindle to a fraction of its original glory. Well no decisive action was taken, and it’s now 2022, so we might as well see how close to accurate the prediction is.

Probably the most reliable source on the state of the GBR is the Australian Institute of Marine Science. Every year, it does an extensive survey of the GBR and publishes its results. The study splits the GBR into three specific regions (Northern, Central, and Southern). I showed the results from last year’s survey about a year ago. Here are the results of this year’s survey:

Notice that for the northern and central regions of the GBR, coral cover is at an all-time high, and more than THREE TIMES the value predicted in the prestigious scientific journal. While coral cover in the Southern region isn’t at an all-time high, it is still more than three times the amount that was predicted.

Obviously, then, we can add this to the ever-growing list of falsified predictions made by those who care more about scaremongering than good science.

*NOTE: By “falsified,” I do not mean “altered in order to mislead,” which is the first definition. I am using it in the scientific sense, which means “shown to be false.” Scientific theories must make predictions. If those predictions are verified, the theory gains credibility. If they are falsified, the theory loses credibility.
Return to Text

Despite What You Have Read, Wildfires are NOT on the Rise

One of the more common myths associated with “climate change” (aka global warming) is the idea that wildfires are on the rise. Consider, for example, the article entitled, “How do we know wildfires are made worse by climate change?” It states:

In 2019 Australia was burning. In 2020 Siberia and California were burning. These are only the more recent examples of dramatic extreme wildfire. People are asking if forest fires are linked to climate change.

The experts tell us that yes, the growing extent and increasing severity of wildfires are indeed driven by climate change.

There is only one problem with such nonsense: wildfires are most definitely NOT increasing in severity. How do we know this? The European Space Agency has been using satellites to track global wildfires. At first, their data sets started in the year 2000, and those data sets show that over the past 20 years, there has been a slight decrease in the amount of land that was burned by wildfires.

However, they recently used historical satellite images to increase the length of time covered by their datasets. We can now trace the amount of land burned by wildfires all the way back to 1982. Thus, we have nearly 40 years worth of data that cover the entire world. What do the data show? The graph is at the top of the article. As you can see, there is no discernible trend. The amount of land burned by wildfires changes from year to year, but the average remains remarkably constant.

Like much of what you read about “climate change,” then, the idea that wildfires are becoming more severe or more frequent is just patently false. Unfortunately, no amount of data will stop this false claim from being promulgated, because most people writing about this issue care more about their agenda than they do about science.

Monarch Butterflies Provide a Lesson About Climate Change Hysteria

A cluster of monarch butterflies in Santa Cruz, CA (click for credit)

North American monarch butterflies perform an incredible migration from their summer breeding grounds to a place where they spend the winter. Most of the monarchs that are born east of the Rocky Mountains travel to Mexico, while those born west of the Rocky Mountains fly to the California Coast. Last year, the headlines about those that travel to California were dire:

Probably the most beloved and recognized butterfly in the United States, the western monarch is essentially on the brink of extinction, said Katy Prudic, co-author of a new report from the University of Arizona that found that the monarchs, along with about 450 butterfly species in the Western United States, have decreased overall in population by 1.6% per year in the past four decades.

Like much of what you read in science news, that’s just not true. The Xerces Society for invertebrate conservation does detailed surveys of western monarch populations, and here are their results for the “Thanksgiving Count,” which is done over three weeks around Thanksgiving:

Looking at the graph, you can see that Katy Prudic is simply wrong. In fact, the western monarch population has both decreased and increased over the past 24 years. Of course, you can also see why the headlines were dire in 2021. The monarch population is barely visible on the graph in 2020. It was the lowest seen in the entire period. So clearly, western monarchs were on the verge of extinction. However, last year’s count shows a population that is the eighth largest in that same time period!

And honestly, anyone who studies these amazing migrations should not be surprised. After all, the population of the monarchs that migrate to Mexico experienced a similar dramatic drop in population back in 2014, but they also recovered from it.

What does this have to do with climate change, aka global warming? First, there have been the predictable attempts to cite it as a cause for the monarchs’ woes. More importantly, however, it shows how dangerous it is to use a trend in nature to make dire predictions.

In both populations, the number of monarchs increased and decreased, but the overall trend for more than 20 years was downward. Then, there was a sudden change, and the decline stopped. This is the way nature works. There is a lot of variation, and tenuous trends in those variations usually don’t mean much.

Now don’t get me wrong. There is a lot of value in collecting data like population counts and global temperatures, and it is important to be concerned about apparent trends. A good scientist, however, should understand that apparent trends are not necessarily actual trends. As a result, good scientists should not make definitive predictions based on them.

Slaughtering Species in the Name of “Green Energy”

A wind farm in California at sunset (click for credit)

Nine years ago, I wrote about a study that indicated wind turbines in the U.S. kill more than half a million birds and more than 800,000 bats each year. Five years later, I wrote about another study that indicated wind farms act as apex predators in the ecosystem where they are built. While very little of this important information makes its way into the popular press, it has informed those who actually care about the environment. As a result, more studies have been done, and these studies indicate something rather surprising about two of the “green energy” solutions that have been promoted to “save our planet.”

So far, the most chilling study was published in Royal Society Open Science. The authors of the study collected feathers of dead birds found at selected wind farms and solar energy facilities in California. They found that of the many species killed by these “green energy” sites, 23 are considered priority bird species, which means their long-term survival is threatened. The list is quite diverse, including the American white pelican, the willow flycatcher, the bank swallow, and the burrowing owl.

Now, just because a species is threatened, that doesn’t mean a few extra deaths are going to be a problem. After all, these facilities are in specific places, and bird populations can cover wide geographical regions. A few extra deaths in some regions can be compensated for by more reproductivity in other regions. Thus, the authors used models to estimate the impact that deaths from wind farms and solar facilities will have on the overall populations. They conclude:

This study shows that many of the bird species killed at renewable energy facilities are vulnerable to population or subpopulation-level effects from potential increases in fatalities from these and other anthropogenic mortality sources. About half (48%) of the species we considered were vulnerable, and they spanned a diverse suite of taxonomic groups of conservation concern that are resident to or that pass through California.

In other words, the study indicates that 11 priority bird species that live in or pass through California are now more at risk because of “green energy” sites in that state. Now, of course, this conclusion is model-dependent, and the models might be wrong. However, at minimum, this study identified with certainty that at least 23 species of threatened birds are being slaughtered at wind farms and solar facilities. That should cause people who actually care about the natural world at least some concern. Unfortunately, even though this study was published a month ago, I haven’t seen a single report about it in the popular press.

As an aside, it’s pretty obvious how wind farms kill birds, but how do solar energy facilities do it? The short answer is that we don’t know. What we do know is that birds tend to crash into solar panels. Perhaps they interpret the shiny surface of the solar panels as a body of water where they can land. Perhaps they interpret it as more sky. Whatever the reason, we know that birds are dying at solar farms. Preliminary research indicates that in the U.S., somewhere between 37,800 and 138,600 die each year as a result of crashing into solar panels.

So what’s the take-home message from this study? It’s rather simple:

The “green energy” solutions touted by politicians and the press are not necessarily better for the environment.

The fact is that “green energy” processes are mostly new, so their long-term effects on the environment are mostly unknown. Ten years ago, no one would have thought that wind farms and solar facilities might be threatening the long-term survival of certain bird species. We now know otherwise. And don’t forget the bats. The effect that wind farms have on their populations hasn’t been studied in nearly as much detail, even though more bats are slaughtered by wind farms than birds!

Those who are pushing “green energy” might actually be pushing environmentally-hostile energy without even knowing it. That’s what happens when those who call themselves “environmentalists” ignore science and simply follow the politicians and the press.

The Great Barrier Reef Is Doing Well, Despite What the Alarmists Have Said

A portion of the Great Barrier Reef (click for credit)

Over the years, the headlines have been dire. Just two years ago, USA Today claimed:

Great Barrier Reef can’t heal after global warming damage

Similar news outlets ran similar headlines, because a study showed that the number of new corals being produced was significantly lower than normal.

The problem, of course, is that such studies have no context whatsoever. Yes, the Great Barrier Reef went through some tough years. Lots of corals experienced bleaching, a process by which they expel the algae that live inside them. Since the algae provide a significant amount of food to the corals, bleaching can be deadly. However, it’s a process we still don’t understand well, and there is some evidence that it is actually a mechanism designed to help the coral adapt to changing conditions. In addition, bleaching events have been happening for more than 300 years, and evidence suggests they happened more frequently in the late 1800s, the mid 1700s, and the late 1600s than they do today.

Given these facts, it’s not surprising that the doom and gloom headlines about the Great Barrier Reef have been shown to be completely wrong. The Australian Government, in collaboration with the Australian Institute of Marine Science, has been monitoring the health of the reef since 1985. They have collected an enormous amount of data, but I just want to focus on Figures 3, 4, and 5, which show the amount of coral cover in the Northern, Central, and Southern Great Barrier Reef.

The blue lines represent the percent of the area that is covered in coral, and the light-blue shading represents the uncertainty in that value. Notice that in each part of the Great Barrier Reef, there are times when the coral coverage is high, and there are times when it is low. Sometimes, the coral coverage is very low. Nevertheless, right now, coverage is nearly as high as it has ever been. Contrary to what USA Today claimed just two short years ago, then, the Great Barrier Reef has recovered from its low point over the past few decades.

Does that mean there’s nothing wrong with the Great Barrier Reef? Of course not! With less than 40 years of direct study, we really don’t know what the overall status of the reef should be, so we have no idea whether what we are seeing now is good, bad, or indifferent. My point is simply that it’s too easy for scientists and the media to look at a short-term trend (like 2010-2106 in the Northern Great Barrier Reef) and draw irrational conclusions. In the end, that not only hurts the cause of science, but it also makes it nearly impossible for us to figure out how best to care for the creation God has given us.

How Preconceptions Influence Science

Two different scientific reconstructions of the average energy the earth has received from the sun since 1800. (graphs edited from one of the papers being discussed, original shown below)

In its Climate Change 2014 Synthesis Report Summary for Policymakers, the Intergovernmental Panel on Climate Change (IPCC) stated:

It is extremely likely that more than half of the observed increase in global average surface temperature from 1951 to 2010 was caused by the anthropogenic increase in greenhouse gas concentrations and other anthropogenic forcings together. (p. 5, emphasis theirs)

In other words, more than half of the warming that has been observed since the mid 1900s has been caused by human activity. How did they arrive at that conclusion? The scientists involved attempted to determine the natural variation in global temperature that would have occurred without human influence, and they found that it accounted for less than half of the observed warming that has been observed. Thus, human activities are responsible for more than half.

The problem, of course, is how do you determine how much warming would have occurred without human activity? The way the IPCC did it was to look at the natural variation that has occurred in the factors that are known to influence the temperature of the planet. One of the biggest factors is how much energy the earth is getting from the sun, which is often called the total solar irradiance (TSI). Well, we have been measuring the TSI with satellites since 1979, and while each satellite comes up with a slightly different value (the reason for that is unknown), all of them agree on how it has varied since they began their measurements.

However, in order to properly understand the long-term effect of TSI, we need to go farther back in time than 1979. As a result, observations that should be affected by TSI are used to estimate what it was prior to 1979. These are called “proxies,” and their use is common among scientists who attempt to reconstruct various aspects of the past. Unfortunately, it’s not clear what the best proxies are for TSI, so the details of how it has changed over time varies substantially from one study to another. That’s what I am attempting to illustrate in the figure above. It shows two different graphs for how TSI has changed since the year 1800. Notice the one on the left (from this study) shows that TSI has been quite variable, while the one on the right (from this study) shows it hasn’t varied significantly over the same time period. Both of these studies were published in the peer-reviewed literature, and both use accepted methods for reconstructing TSI from proxies. The difference, of course, is caused by the different preconceptions in each group of scientists. Whose preconceptions are correct? We have no idea.

To demonstrate just how much variation occurs due to these preconceptions, here is a figure from a very interesting study that I somehow missed when it first came out (in 2015). It shows eight different reconstructions of TSI from eight different peer-reviewed studies:

I used the top two graphs to make the illustration that appears at the very top of the post. As you can see, the eight reconstructions are arranged so that the ones which show a high variability in TSI are on the left, and the ones which show a low variability are on the right. What about the “CMIP5” that shows up on low-variability graphs. It indicates that those were the graphs used in the IPCC’s Climate Change 2014 Synthesis Report, which I quoted above.

Think about what that means. The IPCC specifically chose from the scientific literature TSI reconstructions that indicate there has been little variation since 1800. Thus, natural variation in TSI cannot explain much of the variation we see in global temperature. However, if they had used one of the reconstructions on the left, their conclusion would have been much different. In fact, the authors of the study from which those eight graphs were taken showed that if you used the top left reconstruction, you could explain the vast majority of the variation we see in the earth’s temperature. Thus, had the IPCC chosen that reconstruction, their conclusion about the effect of human activities on global warming would have been radically different.

Hopefully, you can see what I am driving at. All eight of the reconstructions above are legitimate, peer-reviewed reconstructions of TSI. If you choose the ones on the right, you reach one conclusion about the extent to which human activities have affected global temperature. If you choose the ones on the left, you come to a completely different conclusion. How do you choose? You choose the ones you think are best. In other words, you choose the ones that fit your preconceptions.

Unfortunately, this inconvenient fact is left out of most discussions of climate change. As a result, most people state what the “science” says, when they are utterly ignorant of how much that “science” depends on the preconceptions of the scientists who produced it.