
.jpg)
Coral are amazing animals. They live in a mutualistic relationship with algae, giving the algae a safe home in exchange for some of the food that the algae make through photosynthesis. The variety of colors seen in a coral reef are a result of this relationship. However, coral sometimes expel their algae, turning white. This is called “coral bleaching,” and it generally happens when the water is warmer than usual. the Australian Marine Conservation informs us:
Coral bleaching is a global crisis, caused by increased ocean temperatures driven by carbon pollution.
This has become a common mantra in the “global warming is going to kill us all” movement, because coral reefs are so fundamentally important to the health of ocean ecosystems. Indeed, it has become so important that if you question what the global-warming alarmists say, it can lead to dire consequences.
Consider, for example, the case of Dr. Peter Ridd. Some of his colleagues at James Cook University published work indicating that Australia’s Great Barrier Reef was on the verge of collapse because of global warming. Dr. Ridd dared to question that narrative, pointing out the data that indicate there is nothing unusual about the bleaching events that have been occurring at the Great Barrier Reef and that the reef has about the same amount of healthy coral as it did back in 1985. For that transgression, he was fired. While a court has ruled the firing unlawful, the university plans to appeal the ruling. Regardless of what happens at appeal, it is clear that the firing was anti-science. Criticism of data, even data related to sacred cows such as global warming, is the hallmark of good science. To squelch such criticism is a direct assault on the progress of science.
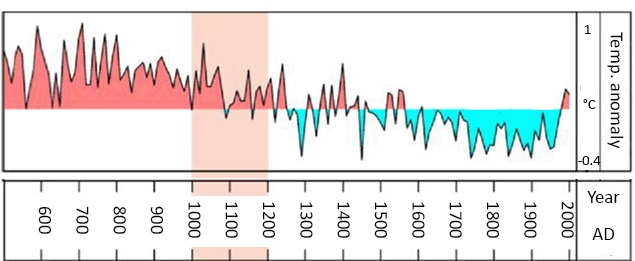
Of course, the real question is whether or not global warming is a threat to the oceans’ coral reefs. The answer remains unclear, but the balance of the evidence indicates that it is not. For example, one study of the Great Barrier Reef shows that bleaching events were more common several hundred years ago. According to that study, bleaching events hit their peak in the 1850s. There is also some indication that bleaching is an adaptive mechanism and is not necessarily bad for the health of a coral reef.


.jpg)