How Preconceptions Influence Science

Two different scientific reconstructions of the average energy the earth has received from the sun since 1800. (graphs edited from one of the papers being discussed, original shown below)

In its Climate Change 2014 Synthesis Report Summary for Policymakers, the Intergovernmental Panel on Climate Change (IPCC) stated:

It is extremely likely that more than half of the observed increase in global average surface temperature from 1951 to 2010 was caused by the anthropogenic increase in greenhouse gas concentrations and other anthropogenic forcings together. (p. 5, emphasis theirs)

In other words, more than half of the warming that has been observed since the mid 1900s has been caused by human activity. How did they arrive at that conclusion? The scientists involved attempted to determine the natural variation in global temperature that would have occurred without human influence, and they found that it accounted for less than half of the observed warming that has been observed. Thus, human activities are responsible for more than half.

The problem, of course, is how do you determine how much warming would have occurred without human activity? The way the IPCC did it was to look at the natural variation that has occurred in the factors that are known to influence the temperature of the planet. One of the biggest factors is how much energy the earth is getting from the sun, which is often called the total solar irradiance (TSI). Well, we have been measuring the TSI with satellites since 1979, and while each satellite comes up with a slightly different value (the reason for that is unknown), all of them agree on how it has varied since they began their measurements.

However, in order to properly understand the long-term effect of TSI, we need to go farther back in time than 1979. As a result, observations that should be affected by TSI are used to estimate what it was prior to 1979. These are called “proxies,” and their use is common among scientists who attempt to reconstruct various aspects of the past. Unfortunately, it’s not clear what the best proxies are for TSI, so the details of how it has changed over time varies substantially from one study to another. That’s what I am attempting to illustrate in the figure above. It shows two different graphs for how TSI has changed since the year 1800. Notice the one on the left (from this study) shows that TSI has been quite variable, while the one on the right (from this study) shows it hasn’t varied significantly over the same time period. Both of these studies were published in the peer-reviewed literature, and both use accepted methods for reconstructing TSI from proxies. The difference, of course, is caused by the different preconceptions in each group of scientists. Whose preconceptions are correct? We have no idea.

To demonstrate just how much variation occurs due to these preconceptions, here is a figure from a very interesting study that I somehow missed when it first came out (in 2015). It shows eight different reconstructions of TSI from eight different peer-reviewed studies:
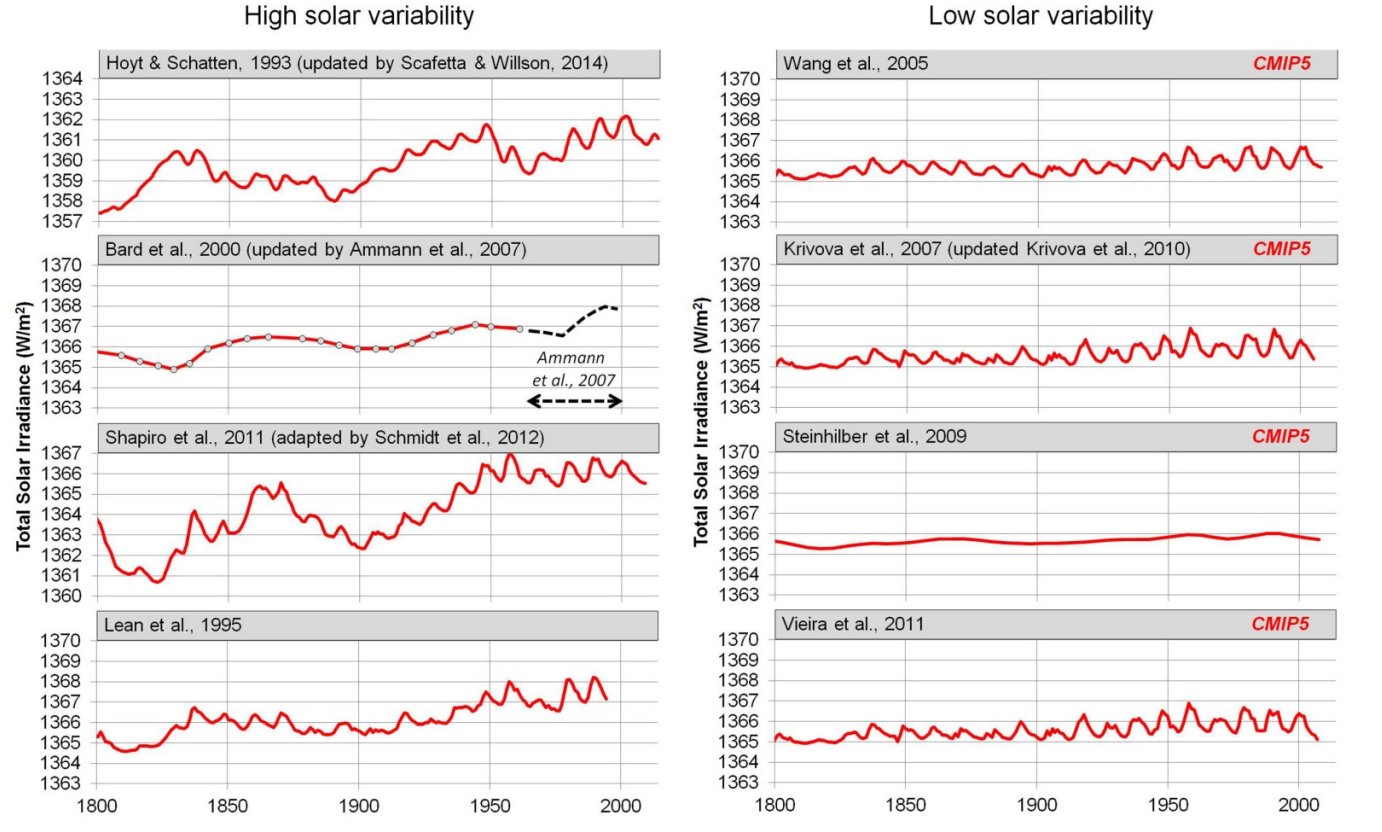
I used the top two graphs to make the illustration that appears at the very top of the post. As you can see, the eight reconstructions are arranged so that the ones which show a high variability in TSI are on the left, and the ones which show a low variability are on the right. What about the “CMIP5” that shows up on low-variability graphs. It indicates that those were the graphs used in the IPCC’s Climate Change 2014 Synthesis Report, which I quoted above.

Think about what that means. The IPCC specifically chose from the scientific literature TSI reconstructions that indicate there has been little variation since 1800. Thus, natural variation in TSI cannot explain much of the variation we see in global temperature. However, if they had used one of the reconstructions on the left, their conclusion would have been much different. In fact, the authors of the study from which those eight graphs were taken showed that if you used the top left reconstruction, you could explain the vast majority of the variation we see in the earth’s temperature. Thus, had the IPCC chosen that reconstruction, their conclusion about the effect of human activities on global warming would have been radically different.

Hopefully, you can see what I am driving at. All eight of the reconstructions above are legitimate, peer-reviewed reconstructions of TSI. If you choose the ones on the right, you reach one conclusion about the extent to which human activities have affected global temperature. If you choose the ones on the left, you come to a completely different conclusion. How do you choose? You choose the ones you think are best. In other words, you choose the ones that fit your preconceptions.

Unfortunately, this inconvenient fact is left out of most discussions of climate change. As a result, most people state what the “science” says, when they are utterly ignorant of how much that “science” depends on the preconceptions of the scientists who produced it.

My Opinion on Harvard’s Initial Sun-Dimming Experiments

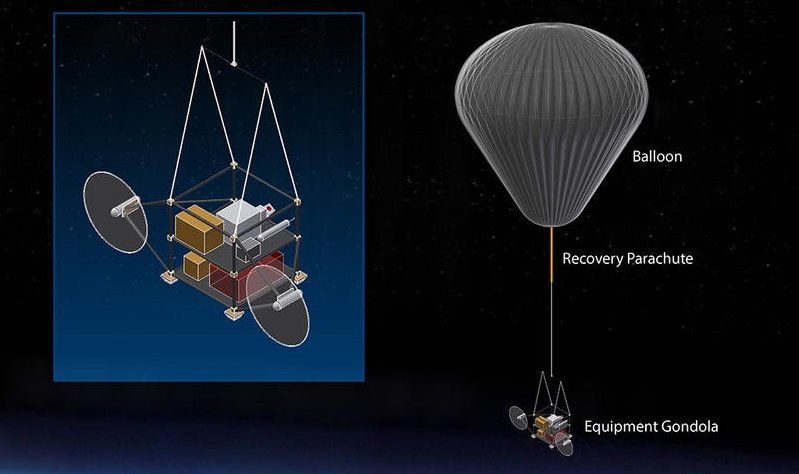
The device Harvard plans to use to study the effect of small particles in the upper atmosphere (Click for source)

A reader sent me this article and asked for my comments on it. For some reason, the experiment that is discussed therein escaped my attention, but I read a more detailed discussion of it and found it to be quite intriguing. Essentially, a team of Harvard scientists wants to know if they can block some of the sun’s light so as to counter the effects of global warming, aka climate change. They want to do it by releasing a fine powder of calcium carbonate (chalk) high in the atmosphere. The tiny particles will eventually fall to the ground, but while they are in the air, they will reflect some of the sun’s light so that it never reaches the surface of the earth. That way, it doesn’t have a chance to participate in the greenhouse effect.

If you have been reading this blog for long, you know that I am very skeptical of the idea that global warming (aka climate change) is a serious problem. We don’t know what portion of it is caused by human activities, and we have no idea how much danger it poses. Unfortunately, politics has poisoned the science surrounding it. As one of the most accomplished climate scientists of our time says, much of what passes as climate science these days is shoddy specifically because of the influence of politics.

Nevertheless, it is certainly possible that global warming (aka climate change) might have serious long-term consequences. As a result, we should look for ways to mitigate the effects, if we eventually find that there will be some. We know the result of cutting carbon dioxide emissions with current technology: people will die. That’s because reducing emissions with the technology we have now makes energy more expensive, and the more expensive energy is, the more people die. (see here and here). Thus, we should examine other methods that might mitigate global warming with a lower body count. That’s what this Harvard experiment is all about.

Are there risks associated with it? Initially, no, because the first experiment, planned for June of this year, would only test the hardware (pictured above). It wouldn’t actually release any powder. If that goes well, the scientists plan a small-scale test that would release no more than 2 kilograms (4.4 pounds) of the powder. That’s not enough calcium carbonate to produce any negative effects. However, it will allow the scientists to study how the calcium carbonate behaves and whether or not the computer simulations of its behavior are correct.

Of course, the issue is what happens next. In order to change the earth’s greenhouse effect in any significant way, there would have to be a lot more calcium carbonate released, and it would have to be released on a semi-regular basis. That could definitely produce serious, long-term consequences. Nevertheless, there is no way to realistically know what those consequences might be unless the initial tests are performed. Thus, this experiment seems reasonable, at least in the initial stages that have been proposed. It will simply be a way of judging the safety and efficacy of the process. The results won’t be definitive, but they can at least guide the scientists in their future plans.

Here’s the bottom line: We know that all currently-planned attempts to slow global warming (aka climate change) will result in people dying. This new approach might result in that as well, but we don’t know. If experiments like the ones planned by Harvard proceed, at least we can have some data that will allow us to see if this method has a lower body count than the currently-proposed methods. It seems to me that’s something worth learning.

An Interesting Interview with One of the Sane Voices in Climate Research

Dr. Judith Curry, a climate scientist who is actually committed to the science. (click for credit)
Dr. Judith Curry holds an earned Ph.D. in geophysical sciences from The University of Chicago. For the last 14 years of her career, she was a professor at the Georgia Institute of Technology. For the majority of that time, she was the chairperson of the School of Earth and Atmospheric Sciences. She has authored 196 peer-reviewed scientific papers and has two books to her credit. By any objective measure, she is a giant in the field of climate science. Because she is actually interested in understanding how climate works, she was officially branded a heretic by the High Priests of Science. Seven years later, she resigned her professorship at the Georgia Institute of Technology because she could no longer figure out, “…what to say to students and postdocs regarding how to navigate the CRAZINESS in the field of climate science.”

Because I respect her knowledge, intellect, and commitment to science, I read her blog. On Saturday, she posted the transcript from an interview she did for a podcast. I am not familiar with the podcast, and I prefer to read rather than listen. In reading the transcript, I found nothing new related to her views on climate change, but I was fascinated by her historical analysis of the field of climate science. While I encourage you to read the entire transcript, I will highlight what really struck me.

When asked about how climate scientists viewed climate change when she was getting her degrees (the 1970s and 1980s), she said that aside from a few “very rambunctious people,” climate change was not a big issue with scientists. When the IPCC formed in the late 1980s, she said that most climate scientists didn’t want to get involved with it:

They said, this is just a whole political thing. This is not what we do. We seek to understand all the processes and climate dynamics, we don’t want to go there. And that was really a pretty strong attitude, through, I would say the mid nineties, say 1995. We had the UN Framework Convention on Climate Change at that point, they’re trying to get a big treaty going. And so defenders of the IPCC started pushing the idea that anybody who doubts us or challenges us, they are in the pay of big oil. After that, it became much more difficult to really challenge all that. And certainly by the turn of the century, anybody who was questioning the hockey stick or any of these other things were slammed as deniers and ostracized. And then after Climategate in 2010, the consensus enforcers became very militant. So it’s a combination of politics, and some mediocre scientists trying to protect their careers. And, they saw this whole thing as a way for career advancement, and it gives them a seat at the big table and political power. All this reinforces pretty shoddy science and overconfidence in their expert judgment, which comprises the IPCC assessment reports.

I found this interesting because as an outsider looking in, I have to agree with her assessment that the IPCC has reinforced “shoddy science.” I don’t know even 5% of what Dr. Curry knows about climate, and I know precisely 0% of what she knows about the internal dynamics of her field. However, after reading each IPCC report (from the 2001 synthesis report on), I was amazed at the shoddiness of the science and the overconfidence they had in their conclusions.

Consider, for example, their view of how humans have impacted the earth’s climate. In 2001, they said that human-emitted greenhouse gases are “likely” responsible for more than half of the earth’s temperature increase since 1951. By 2007, climate scientists had shown that the models used in 2001 were wrong, and they also found new variables related to climate which were poorly understood. Nevertheless, in their 2007 report, the IPCC said that human-emitted greenhouse gases are “very likely” responsible. Over the next six years, climate scientists continued to show that the models used by the IPCC were wrong and continued to find more uncertainties in our understanding of climate. But over that same period, the IPCC decided that that human-emitted greenhouse gases are “extremely likely” responsible.

In real science, when uncertainties grow, the conclusions become more and more tentative. In climate science, the reverse seems to be the case. More uncertainties seem to lead to more confidence in the conclusions. That’s pretty much the definition of shoddy science.

“Climate Change” Is Not Killing Pacific Northwest Coho Salmon

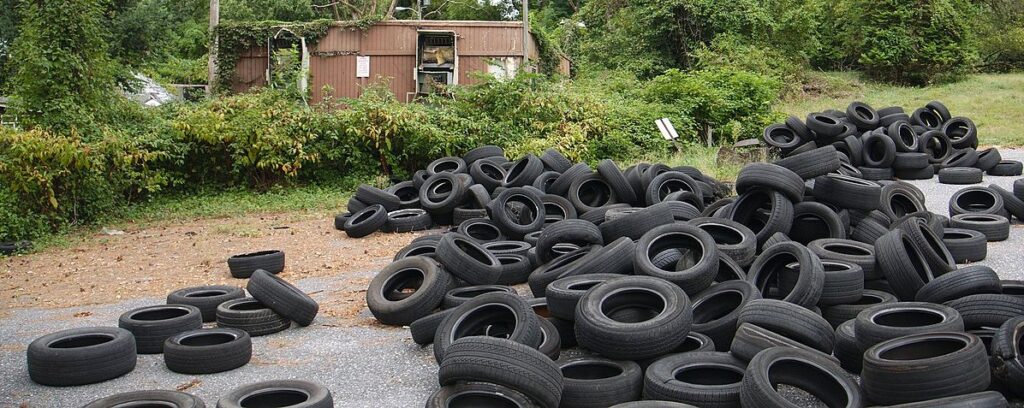
It has become so fashionable to blame every calamity on “climate change” that scientists are overlooking REAL environmental issues, like tire waste. (click for credit)

Nowadays, if you want to get funding and become popular in the scientific community, you need to blame any natural calamity you are studying on climate change (aka global warming). For example, salmon populations in the west have been on the decline, and predictably, global warming has been trumpeted as the cause. As one source suggests:

Pacific salmon that spawn in Western streams and rivers have been struggling for decades to survive water diversions, dams and logging. Now, global warming is pushing four important populations in California, Oregon and Idaho toward extinction, federal scientists warn in a new study.

Of course, when serious scientists actually looked at the situation, they found that temperature is not responsible at all, at least not specifically for coho salmon. The scientists investigated multiple possibilities, and they ruled out rising temperatures. As one of the authors stated:

We had determined it couldn’t be explained by high temperatures, low dissolved oxygen or any known contaminant, such as high zinc levels…

Like good scientists, then, they ruled out the “fashionable” explanation and decided to find the real cause. Not surprisingly, they did. They found that urban stormwater runoff could cause the same symptoms that were known to be killing the coho salmon, so the authors painstakingly analyzed the runoff and ran multiple tests.

They identified the chemical that was killing the coho salmon but could not figure out where it came from. Eventually, the researchers found that this chemical was similar to a preservative used in tires, which is charmingly known as “6PPD.” After several experiments, they found that when 6PPD is exposed to ozone and sunlight, it can be broken down into the killer chemical. Thus, the coho salmon are not being killed by today’s favorite boogeyman. Instead, they are being killed by a chemical produced as a result of tire waste.

Now, of course, since the authors of this study seem to be careful scientists (unlike so many that exist today), they are unwilling to generalize their results. Thus, this conclusion applies only to what is killing the coho salmon in the Pacific Northwest. There might be other causes for what is killing the other species, but I hope this motivates scientists to question the “fashionable” explanation of “global warming” and actually do some serious scientific investigation, like this team did. If so, real science might still be able to help us understand (and the hopefully fix) the problem.

Yes, The World Was Warmer Before “Global Warming”

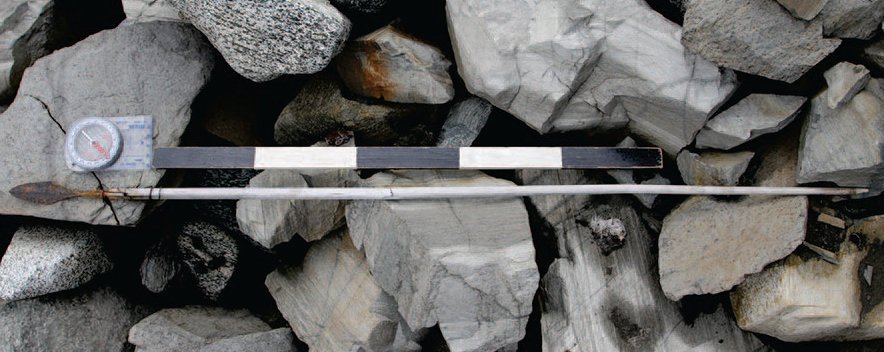
An arrow that is roughly 800 years old. It was exposed by melting ice in Norway.
(image from study that is being discussed)

If you get all your information regarding climate change, aka “global warming,” from social media or most news outlets, you would think that we are living in a time of unprecedented warmth. However, if you read the scientific literature, you know that climate proxy data from around the world indicate that this is just not true. If you aren’t familiar with the term, “climate proxy” refers to data that scientists use to attempt to understand climate conditions of the past. Tree rings, for example, are sensitive to temperature and precipitation, so it is thought that we can use them to determine past climate conditions. Many climate-sensitive things like recorded harvests, coral growth, pollen grains, etc. can be used as climate proxies. Analysis of such climate proxies indicate that the earth was significantly warmer in the Middle Ages than it is today. Climate scientists refer to it as the “Medieval Warm Period,” the “Medieval Climate Anomaly,” or the “Medieval Climate Optimum.”

Those who are invested in promulgating terrifying stories about the effect people have on the earth’s climate attempt to downplay or disregard this well-established part of the earth’s history, but the data are quite convincing. The latest set of evidence to be added to the pile is an archaeological study from Norway. The first line of its abstract reads:

In the context of global warming, ice patches are increasingly important foci of high-elevation archaeology.

In other words, places like the area examined in the study have been covered in ice for a long time, but now, because of global warming, that ice is melting, revealing what has been entombed there.

What did the melted ice reveal? 68 arrows and five isolated arrow heads. This led the authors to describe the area as “…the most arrow-rich known ice patch site in the world.” They used carbon-14 dating to determine the age of the artifacts, and they say that their finds range from about 700 years old to 6,000 years old. The older the age, the less reliable carbon-14 becomes, so I doubt that any of those ages are really correct. However, we can certainly say that these arrows come from a time long before the Industrial Revolution!

Why do people make arrows? To hunt game. The authors conclude that this area, which has been covered in ice during recent times, was a rich hunting ground during several periods in the past. That means the area must have been much warmer in the past. Now, of course, we can’t make any conclusions about the earth’s climate from just one region. However, it is at a high elevation in the northern part of the globe (latitude 61 degrees). Such areas tend to stay cold, so the fact that it was warmer in the past is best understood in the context of a warmer earth. This adds weight to the proxy data, allowing us to more confidently conclude that there is nothing unusual about the temperatures the earth is experiencing right now.

Yes, the climate is changing. It is always changing. Yes, human activity probably has something to do with it, although the magnitude of that effect is unknown right now. However, the vast majority of the evidence indicates that what we are experiencing right now is not in any way unprecedented.

This Study Says That More Carbon Dioxide Will Not Cause Much More Warming

Carbon dioxide absorbs the infrared radiation that the earth emits, trapping it before it leaves the planet. This warms up the atmosphere, making the earth a haven for life. Obviously, then, the more carbon dioxide we put into the atmosphere, the warmer it will get, right? Not necessarily! As I tell my high school and university students over and over again: Science isn’t simple! As a result, conclusions that seem “obvious” to most people (even most scientists) are often absurdly wrong. A recently-produced study that has not yet been published in the peer-reviewed literature makes this case about carbon dioxide and global warming, aka “climate change.”

The “obvious” conclusion that more carbon dioxide means more global warming ignores the fact that carbon dioxide doesn’t absorb all the infrared radiation it encounters. Instead, it only absorbs specific wavelengths. In addition, the amount of each wavelength that carbon dioxide can absorb varies with wavelength, the temperature at which the absorption happens, the concentration of the gases in the surroundings, etc., etc. Because of such effects, there comes a time when adding more carbon dioxide to the atmosphere has a negligible effect on the amount of infrared radiation absorbed. When that happens, you have reached saturation, and increasing the amount of carbon dioxide will not increase the atmosphere’s warming.

Now all of this is well known, and most global warming models attempt to include these effects in their calculations. The problem is that they treat them in a crude way. This is understandable, since a model that is trying to simulate the entire atmosphere has to consider a lot of things. As a result, most of them are treated crudely so that the model doesn’t become overwhelmingly convoluted. That’s where this unpublished study comes in. The authors test the effect of treating the science related to saturation crudely, and they say it renders the models pretty much useless when it comes to understanding how carbon dioxide affects the present atmosphere.

How do they come to this conclusion? They consider more than 300,000 different infrared wavelengths that carbon dioxide and other greenhouse gases (water, ozone, methane, and dinitrogen oxide) absorb. They compute how much the gases will warm the atmosphere by absorbing each wavelength. First, they make the computation without considering details like the temperature, the other gases in the atmosphere, etc. This is roughly equivalent to how current models treat the situation. Then, they do it considering all those details, using the present makeup of the atmosphere. They find that in the present atmosphere, the amount that more carbon dioxide can contribute to global warming is 10,000 times smaller than what current models assume. The same can be said for water vapor. For carbon dioxide and water vapor, then, the atmosphere is very, very close to saturation. As a result, more carbon dioxide and water vapor in the atmosphere will not warm the planet in any meaningful way. Ozone, dinitrogen oxide, and methane are also close to saturation, but not nearly as close as carbon dioxide and water vapor.

How do we know that their analysis is correct? We don’t. When they compare their calculations of how much infrared radiation is being absorbed for each wavelength to what satellites have been measuring, they see virtually no difference. Thus, their calculations seem to reflect reality very well. However, I am not very knowledgeable about the details, so there might be fatal flaws in their analysis that I am not seeing. Once again, science isn’t simple. I really hope this gets published in the peer-reviewed literature so that experts can weigh in on the conclusions. Unfortunately, I am not confident this paper will get that far. If its conclusions are correct, then there is absolutely no basis for the fear-mongering that surrounds carbon dioxide emissions. There are so many scientists whose careers have been made based on that fear-mongering, they may simply keep the paper from being published.

Fortunately, science is self-correcting. One way or another, we will figure out the details related to this issue. It might take longer than it should, and it might be after terrible decisions have been made based on faulty climate science, but at some point in the future, we will find out whether or not these authors are correct. I hope it is sooner rather than later!

Climate Change Activist Issues an Apology, Which Forbes Censors

Author Michael Shellenberger (click for credit)
Author Michael Shellenberger’s career has been one of climate activism. He was named one of Time magazine’s Heroes of the Environment back in 2008. He and co-author Ted Nordhaus wrote the ground-breaking book Break Through: From the Death of Environmentalism to the Politics of Possibility, which won the 2008 Green Book Award. He now runs Environmental Progress, which has two goals: to lift all humans out of poverty, and to save the natural environment.

Recently, he penned a letter that was originally published at the Forbes website. However, it was quickly taken down, because it didn’t conform to the narrative that Forbes is trying to impose. This isn’t the first time Forbes has published a reasonable article that was then removed for violating its orthodoxy, and it probably won’t be the last. After all, as more people learn the science behind global climate change, aka global warming, more articles challenging Forbes’ dogma will surface. Some of them will probably make it past the censors, but when their heresy is later exposed, they will be put on Forbes’ Index Librorum Prohibitorum.

Fortunately for all of us, Shellenberger’s organization has defied the Inquisition and has published the article that the censors at Forbes removed. I encourage you to read the entire article, but in brief, Shellenberger offers an apology on behalf of those who have been trying to frighten you regarding global climate change, aka global warming. Why is he apologizing? Because he knows enough science to realize that

Climate change is happening. It’s just not the end of the world. It’s not even our most serious environmental problem.

Unfortunately, as his letter says, he stayed silent about the science because he believes that cutting carbon-dioxide emissions is a good thing. Thus, he worked alongside the fear-mongers without speaking out against their anti-science rhetoric. Now, however, he thinks that the assault against science has gotten out of control, and he was forced speak out.

I encourage you to read his entire apology. Not only will you learn some good science, you will see how an honorable person admits that he acted wrongly.

Yet Another Mistake Made in Climate Models

Computer models are the main source of hysteria when it comes to global warming.
(Image a montage from two sources: pixabay.com and stockunlimited.com)

When you read or listen to the news, you are faced with dire predictions about global warming, aka “climate change.” For example, ABC news states:

Global warming will be twice as severe as previous estimates indicate, according to a new study published this month in the Journal of Climate, a publication of the American Meteorological Society. The research, conducted by the Massachusetts Institute of Technology (MIT), predicts a 90% probability that worldwide surface temperatures will rise more than 9 degrees (F) by 2100, compared to a previous 2003 MIT study that forecast a rise of just over 4 degrees.

Of course, a 9 degree Fahrenheit increase in global temperature will produce catastrophic results. How did the researchers come to the startling conclusion that there is a 90% chance it will happen? They used a computer model that attempts to simulate global climate under different scenarios. The problem, of course, is that the prediction is only as good as the model.

The obvious question, then, is how good are the models? The unfortunate answer is, “Not good at all.” As Distinguished Professor of Atmospheric Science Dr. John Christy has stated:

On average the models warm the global atmosphere at a rate three times that of the real world. Using the scientific method we would conclude that the models do not accurately represent at least some of the important processes that impact the climate because they were unable to “predict” what has occurred. In other words, these models failed at the simple test of telling us “what” has already happened, and thus would not be in a position to give us a confident answer to “what” may happen in the future and “why.”

Why are the models so bad? Because we don’t really understand climate science well enough to model it. A recent paper by Professor of Atmospheric Science Da Yang and his graduate student, Seth Seidel, provides a crystal clear example of what I mean. The paper’s abstract begins this way:

Moist air is lighter than dry air at the same temperature, pressure, and volume because the molecular weight of water is less than that of dry air. We call this the vapor buoyancy effect. Although this effect is well documented, its impact on Earth’s climate has been overlooked.

Because of its lower molecular weight, water vapor is less dense than air at the same temperature, so air with a lot of water vapor floats in dry air at the same temperature and pressure. As the paper says, this is well documented. However, no one thought to see how that might affect the earth’s climate. Well, these two scientists decided to do just that, and based on their calculations, it actually cools the atmosphere.

Here’s a simplified explanation for why: In the tropics, we find regions of wet air and regions of dry air. At the same elevation, the regions must have roughly the same density. Otherwise, the less dense region would rise. Thus, if I have a stable region of wet air next to a stable region of dry air, the dry air must be warmer, so it has the same density as the wet air. Thus, at any given elevation, the dry regions will be the warmer regions. Well, water vapor is a potent greenhouse gas, so wet air doesn’t allow as much energy to escape from the earth as dry air. Since the dry air is warmer, there is more energy in it. That means the energy is more concentrated in the air that will allow more of it to escape. This, of course, results in the earth getting rid of more energy, which causes it to cool.

Now here’s the interesting part: the author’s calculations show that this effect becomes magnified the higher the ocean temperature. In other words, if the tropical oceans warm up, this effect will end up producing even more cooling. This is an example of a negative feedback system, where a change produces an effect that resists the change. The earth’s climate is full of negative feedback systems (see here, here, here, and here, for example). This is exactly what you expect for a well-designed system, and the earth is a very well-designed system.

In their paper, the authors state that the climate models from which dire warnings are generated have the ability to simulate this effect, but they don’t. They suggest that climate models should be adjusted to take the effect into account. Of course, I agree. Whenever we learn more about climate dynamics, the models should be updated. However, my point is much more basic: This is a well documented, well understood aspect of the atmosphere, but until now, no one has thought to see its effect on the earth’s climate. After investigation, it is found to produce negative feedback, which makes earth’s climate more resistant to change. If this well documented, well understood aspect of the earth’s atmosphere has not been properly taken into account in the climate models that are forecasting doom and gloom, how in the world can we put any faith in them?

Once Again, Don’t Get Your Science from Facebook!

A visualization of the Australian fires that have happened recently (by Anthony Hearsey and Creative Imaging: click for more info)
I have made two posts so far cautioning people to be very skeptical of science-related Facebook posts (see here and here). In general, you should be skeptical of anything on any social media site, but science is easily skewed and misrepresented, especially when people are trying to show their own virtue by championing some cause.

One case in point comes from the Australian bushfires that are wreaking havoc throughout the country. My Facebook feed recently showed me the image you see on the left. The person posting wanted to make me aware of how devastating the bushfires in Australia have become, so he posted this picture. While it does indicate an incredible level of devastation, it isn’t really true. There are two problems with the image. First, it looks like a satellite photo that is showing the fires burning right now, but it is not. It is an image that was developed on a computer, and it doesn’t show how Australia is burning right now or at any other time in the past. Each “flame” in the image represents a fire that burned sometime this season. In other words, it shows any region of Australia that had a fire this season, but it shows that region as on fire right now. In fact, many of the fires depicted on this image have been extinguished.

There is a bigger problem that is common with all visualizations of this kind. When you make an image like this, you need to add “fire” in the region where there is or was a fire. However, the image represents something very, very large. Suppose there was a fire that burned three square miles. That’s a big fire, but in this image, it would be represented by a red dot that is one millionth the size of the image. Thus, it wouldn’t show up. In order to make it show up, you need to make it bigger. However, that makes it look like more than three square miles were burned.

This issue is called “gridding.” When dealing with a large object, it must be partitioned into small sections by drawing a grid. If the sections in your grid are very large compared to the areas that you are depicting, the resulting depiction is deceptive. So, in fact, even considering all the fires that have happened so far this season (extinguished or not), they haven’t covered as much of Australia as the “flames” on this map.

Now don’t get me wrong. I am not saying that the fires in Australia are nothing to be worried about. They most certainly are devastating! They probably represent the worst bushfires in the past hundred or so years. That’s a bit hard to tell, because some of the most devastating fires in Australia occurred in the past, when news coverage wasn’t very good. We know, for example, that in 1851 widespread bushfires killed at least 12. In 1939, bushfires killed at least 71. While it does look like the current bushfires are burning a larger area than any of the previous ones, it is hard to say that with certainty. Regardless, the image above definitely overstates their severity.

Continue reading “Once Again, Don’t Get Your Science from Facebook!”

A Bacterium That “Eats” Carbon Dioxide…and a Creationist Prediction

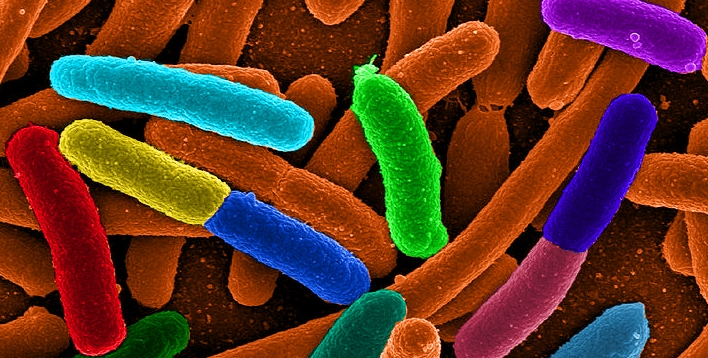
A false-color scanning electron microscope image of Escherichia coli. The different colors represent bacteria with different traits.

Escherichia coli (E. coli) are the workhorses of the bacterial world. They are found in every human being and most warm-blooded animals, but they are also found in laboratories all over the world. Because they are easy to care for, reproduce quickly, and have a genome that is reasonably well-understood, they are a popular subject of study among biologists. In addition, they end up producing a lot of chemicals that we need but are unable to produce ourselves. For example, insulin is a protein that all people need, but some people don’t make enough of it (or don’t respond well enough to it) to remain healthy. That leads to diabetes, and one treatment for diabetes is regular insulin injections.

While the insulin in pigs and cattle is close to what we find in people (and was used to treat diabetes for a long time), the best insulin for most diabetics is human insulin. Unfortunately, even with the best technology available, we aren’t good enough chemists to make insulin, but simple organisms like bacteria are. As a result, scientists have learned how to insert the human gene for insulin into a bacterium, which allows the bacterium to do the chemistry for us. As a result, much of the insulin used to treat diabetics today is human insulin produced by E. coli bacteria.

Unlike some species of bacteria, however, E. coli have to eat in order to get the energy and raw materials they need to do that chemistry. This ends up producing carbon dioxide as waste. To reduce the buildup of carbon dioxide in the atmosphere, then, it would be nice to produce chemicals like insulin from an organism that does not produce carbon dioxide in order to live. There are technical problems with that, however, so right now, diabetic insulin (and many other medically-related chemicals) adds to humanity’s “carbon footprint.” There are two ways to fix this: Either figure out how to use organisms that don’t have to eat (like organisms that make their own food through photosynthesis) or change E. coli so that it doesn’t have to eat.

In a recent study, scientists have been working on the second alternative and have experienced some success. As a byproduct, they have produced something that can be used to test creationism.

Continue reading “A Bacterium That “Eats” Carbon Dioxide…and a Creationist Prediction”