New Archaeological Find Supports the Biblical Account of Gideon

Dutch painter Pieter Aertsen’s imagining of Gideon tearing down the altar to Baal
In the sixth chapter of the book of Judges, we read that the children of Israel were being oppressed by the Midianites. A young man named Gideon was harvesting wheat and trying to hide from the Midianites when an angel of the Lord visited him and told him that he could save the children of Israel. As a first step, Gideon had to tear down the altar to Baal that his fellow Israelites had constructed. Gideon did as the angel commanded, and when the people heard what he had done, they wanted to execute him. His father (Joash) stopped the execution with some simple logic:

But Joash said to all who stood against him, “Will you contend for Baal, or will you save him? Whoever will contend for him shall be put to death by morning. If he is a god, let him contend for himself, since someone has torn down his altar!” Therefore on that day he named Gideon Jerubbaal, that is to say, “Let Baal contend against him,” because he had torn down his altar.

Gideon went on to lead a small army of untrained men against the Midianites, saving the children of Israel from them. The Gideons International, an organization of which I am a member, takes their name from this inspiring Biblical account.

Recently, archaeologists have uncovered evidence that supports one detail of this account. While digging in a small site 3 km west of the large archaeological site/Israeli National Park called Tel Lachish, they uncovered pottery fragments that are thought to have been made in the late twelfth or early eleventh century BC, which is the same time period in which Gideon’s story happened.

While the pottery is far from complete, the recovered pieces contain a painted inscription that reads, “Yrb‘l,” which means Jerubba‘al, the name Joash gave his son. In discussing their find in the context of other relevant finds, the archaeologists say:

The chronological correlation between the biblical tradition and ancient Judean inscriptions indicates that the biblical text preserves authentic Judean onomastic traditions.

In other words, this find and others indicate that the names mentioned in the Bible are not fictional. They are real names that were used in the relevant geographic and historical settings.

My Review of Exploring Creation With Earth Science

Cover of the book being reviewed, emphasizing the new author.
Normally, the only new titles I review from my former publisher are those that I originally wrote or had an important hand in developing. So far, I have reviewed six of them (here, here, here, here, here, and here). However, I feel compelled to review this new title, for two main reasons. First, I have just finished writing a middle school/high school earth science course, and some people might wonder if this elementary course will prepare students for my upper-level course. The answer is, “No.” Second, the author is different from all the other books in the publisher’s “Exploring Creation With…” elementary series, and readers need to be aware of that, because it makes this book very different from the others in the series. If you liked the previous books (authored by Jeannie Fulbright), you probably won’t like this new book.

Why do I say that? Let’s start with the way it is written. Fulbright has a knack for explaining science to elementary students without “talking down” to them. In my opinion, that’s not the case with this book. The tone comes off as condescending from time to time. More importantly, Fulbright is passionate about young-earth creationism and includes “Creation Confirmation” sections in her books. These sections highlight how the material being discussed confirms the young-earth creationist view. This book studiously avoids any direct mention of the age of the earth or even the method of creation. Students who use this course will not learn anything about the creation/evolution debate or the age of the earth debate.

Worse yet, while the author doesn’t discuss the age of the earth directly, there are several statements she makes that support an ancient earth. When discussing soil, for example, the author states:

How long does it take to make soil? That depends on where you start. If we start with really big rocks and wait for them to break down through the weathering process we studied, it can take thousands of years until they become the particles we know as sand, silt, and clay.

First, this statement is utterly false. Soil is formed incredibly rapidly during catastrophic floods and other high-erosion events. Second, it implies that sedimentary rocks take longer to form than the young-earth timescale, since the breaking down of rocks through the weathering process is just the first step in making sedimentary rocks. If that takes thousands of years, there is no time left for sedimentary rocks to form.

Now don’t get me wrong. I am not saying it’s bad that the book allows for an ancient earth. I don’t have a problem with that, even though I disagree. The problem is that the rest of the series is unabashedly young-earth, so I would assume that parents will expect this new book to be young-earth, and it is definitely not.

Also, there is not a single mention of the worldwide Flood in the entire course. I can’t imagine Fulbright ignoring such an important topic in the study of geology. After all, if you are a young-earther, the Flood is what shaped most of the geological structures we see today. If you are not a young-earther, you need to explain why you think the Flood didn’t do that. Instead, this book ignores the Flood entirely. It also pretty much ignores fossils! There are two sentences about fossils in this entire earth science book!

Another way this book differs from the others in the series is that it is not a “living book.” Fulbright strove to make her books deep and rich, and she tried to teach science by telling a story. By contrast, this is like an Usborne book. It is full of pictures, random facts, and terms that are often not explained or explained many pages after they are first discussed. In addition, it barely scratches the surface of nearly everything it covers.

There are also many scientific errors in the book. Based on a Wikipedia article, the author says that water is naturally blue, when it can be defined as, “A tasteless odorless colorless liquid with the chemical formula H2O.” She says that pressure isn’t a real force (it is), but then discusses the Coriolis force as if it is a real force (it isn’t). She also says:

The Sun actually provides us too much energy, so the earth has to get rid of some energy or it will overheat. Getting rid of extra heat is something important our atmosphere does.

Of course, the truth is that the atmosphere retains energy through the greenhouse effect in order to make the planet habitable. That is the opposite of what the book says.

If you are interested, this PDF lists the details of the 11 things that show this book is different from the others in the series, the 5 statements that implicitly support an old earth, the 18 serious scientific errors, and the 17 minor scientific errors that I found. It also lists 4 things that I simply do not understand.

How Preconceptions Influence Science

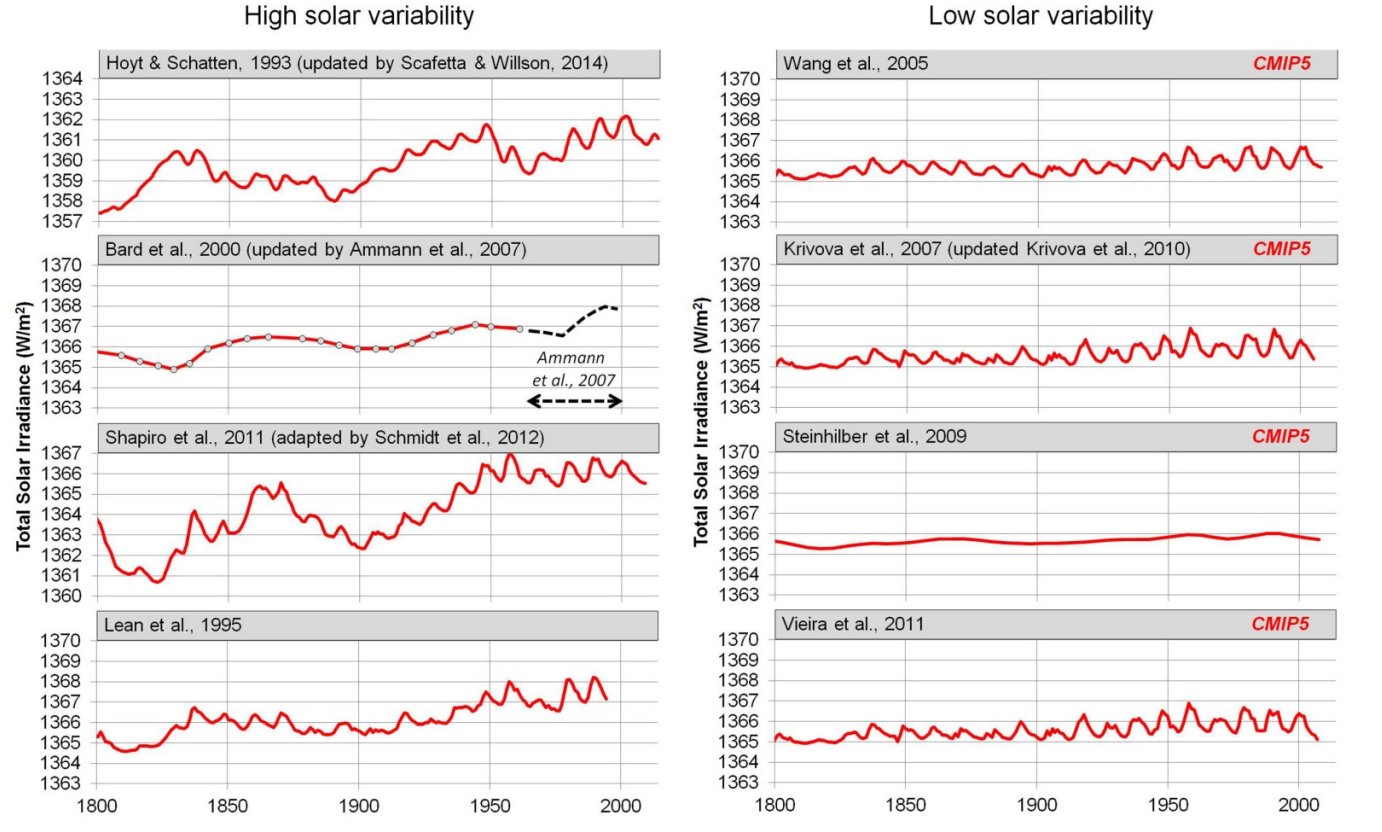
Two different scientific reconstructions of the average energy the earth has received from the sun since 1800. (graphs edited from one of the papers being discussed, original shown below)

In its Climate Change 2014 Synthesis Report Summary for Policymakers, the Intergovernmental Panel on Climate Change (IPCC) stated:

It is extremely likely that more than half of the observed increase in global average surface temperature from 1951 to 2010 was caused by the anthropogenic increase in greenhouse gas concentrations and other anthropogenic forcings together. (p. 5, emphasis theirs)

In other words, more than half of the warming that has been observed since the mid 1900s has been caused by human activity. How did they arrive at that conclusion? The scientists involved attempted to determine the natural variation in global temperature that would have occurred without human influence, and they found that it accounted for less than half of the observed warming that has been observed. Thus, human activities are responsible for more than half.

The problem, of course, is how do you determine how much warming would have occurred without human activity? The way the IPCC did it was to look at the natural variation that has occurred in the factors that are known to influence the temperature of the planet. One of the biggest factors is how much energy the earth is getting from the sun, which is often called the total solar irradiance (TSI). Well, we have been measuring the TSI with satellites since 1979, and while each satellite comes up with a slightly different value (the reason for that is unknown), all of them agree on how it has varied since they began their measurements.

However, in order to properly understand the long-term effect of TSI, we need to go farther back in time than 1979. As a result, observations that should be affected by TSI are used to estimate what it was prior to 1979. These are called “proxies,” and their use is common among scientists who attempt to reconstruct various aspects of the past. Unfortunately, it’s not clear what the best proxies are for TSI, so the details of how it has changed over time varies substantially from one study to another. That’s what I am attempting to illustrate in the figure above. It shows two different graphs for how TSI has changed since the year 1800. Notice the one on the left (from this study) shows that TSI has been quite variable, while the one on the right (from this study) shows it hasn’t varied significantly over the same time period. Both of these studies were published in the peer-reviewed literature, and both use accepted methods for reconstructing TSI from proxies. The difference, of course, is caused by the different preconceptions in each group of scientists. Whose preconceptions are correct? We have no idea.

To demonstrate just how much variation occurs due to these preconceptions, here is a figure from a very interesting study that I somehow missed when it first came out (in 2015). It shows eight different reconstructions of TSI from eight different peer-reviewed studies:

I used the top two graphs to make the illustration that appears at the very top of the post. As you can see, the eight reconstructions are arranged so that the ones which show a high variability in TSI are on the left, and the ones which show a low variability are on the right. What about the “CMIP5” that shows up on low-variability graphs. It indicates that those were the graphs used in the IPCC’s Climate Change 2014 Synthesis Report, which I quoted above.

Think about what that means. The IPCC specifically chose from the scientific literature TSI reconstructions that indicate there has been little variation since 1800. Thus, natural variation in TSI cannot explain much of the variation we see in global temperature. However, if they had used one of the reconstructions on the left, their conclusion would have been much different. In fact, the authors of the study from which those eight graphs were taken showed that if you used the top left reconstruction, you could explain the vast majority of the variation we see in the earth’s temperature. Thus, had the IPCC chosen that reconstruction, their conclusion about the effect of human activities on global warming would have been radically different.

Hopefully, you can see what I am driving at. All eight of the reconstructions above are legitimate, peer-reviewed reconstructions of TSI. If you choose the ones on the right, you reach one conclusion about the extent to which human activities have affected global temperature. If you choose the ones on the left, you come to a completely different conclusion. How do you choose? You choose the ones you think are best. In other words, you choose the ones that fit your preconceptions.

Unfortunately, this inconvenient fact is left out of most discussions of climate change. As a result, most people state what the “science” says, when they are utterly ignorant of how much that “science” depends on the preconceptions of the scientists who produced it.

About That New “Dragon Man” Fossil….

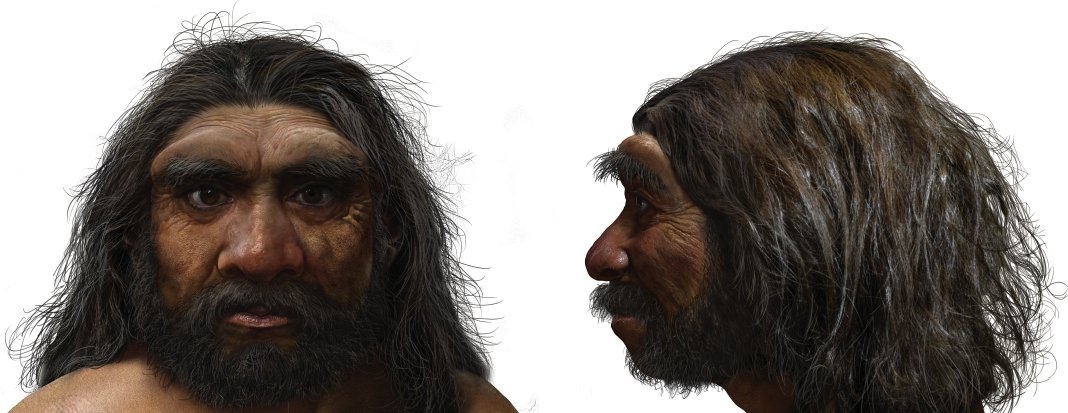
A fanciful imagining of what the person who left behind the skull being discussed in the article might have might have looked like. (image from the scientific paper)

The media is abuzz with a “new” fossil discovery. Consider, for example, this article, which says:

A new species of ancient human dubbed Homo longi, or “Dragon Man,” could potentially change the way we understand human evolution, scientists said Friday.

A reader asked me to comment on the discovery, which I am happy to do. Please remember, however, I am not a paleontologist nor a biologist, so my comments are clearly from a non-expert position. Nevertheless, I think I can add a bit of perspective that is sadly missing in most discussions of this fossil find.

First, while this fossil is just making the news, it is anything but new. As one of the three scientific papers written about it informs us, the skull was discovered in 1933 by a man who was part of a team constructing a bridge. He hid it in an abandoned well, apparently with the idea to retrieve it later. However, he never did. Three generations later, the family learned about the skull and recovered it. One of the scientists who wrote the papers learned about it and convinced the family to donate the skull to the Geoscience Museum of Hebei GEO University back in 2018.
So what’s “new” isn’t the discovery of the fossil; it’s the analysis contained in the scientific papers.

Of course, one part of the analysis tried to answer the question of how old the skull is. Two different radioactive dating methods were used (comparing the ratio of two thorium isotopes as well as comparing the ratio of one thorium isotope and one uranium isotope). As is typical with radioactive dating, the two different methods didn’t agree with one another, and even the same method gave different ages depending on where the sample was taken from the skull. In the end, the ages based on these analyses ranged from 62±3 thousand years old to 296±8 thousand years old. Based on many factors, the authors said that the youngest this fossil could be was 146,000 years old.

Before I move on, I want to use these data to highlight something I have discussed before. The numbers that follow the “±” sign represent what scientists call error bars. They are supposed to tell you the most likely range over which the measurement can actually fall. When you read “62±3 thousand years old,” that is supposed to mean, “62,000 years is the most likely date, but it could be as low as 59,000 years or as high as 65,000 years.” In fact, the actual date could be lower or higher, but the most likely range is 59,000 years to 65,000 years. Notice, of course, that these error bars are utterly meaningless, since the measurements ranged from 59,000 years old to 304,000 years. This is one of the many problems with radioactive dating. Error bars that are utterly meaningless are constantly reported, giving the illusion of a very precise measurement, when in reality, the measurement is anything but precise!

With the “measured” age of the skull out of the way, let’s discuss the main issue. The scientific papers, as well as the media reports, indicate that this is a new species of human. It doesn’t represent “modern” humans, and it doesn’t represent other known “archaic” humans. There is one big problem with this idea. The paper says that based on the characteristics of this skull, the human it represents is more closely-related to modern humans than is Neanderthal Man. The problem, of course, is that we know Neanderthal Man is fully human, because we know that Neanderthal Man interbred with modern humans. Thus, Neanderthal Man is from the same species as modern man. Since this skull indicates its owner is even more closely related to modern humans, it is a modern human as well.

So while this skull can tell us something about the variety that has existed among humans over the years, it tells us nothing about the “story” of human evolution. It simply represents another variety of human being.

The American Biology Teacher Uses False Statements to Reassure Teachers

When dinosaur fossils like this one are tested, they contain carbon-14 in significant quantities, which is not possible if they are millions of years old.
Quite some time ago, a reader sent me this article from The American Biology Teacher. It attempts to assure biology teachers that the large amounts of carbon-14 found in dinosaur fossils is compatible with the scientifically-irresponsible idea that those fossils are millions of years old. The reader asked me to comment on the article, since I have said several times that carbon-14 in dinosaur bones is a very strong indication that the bones are not millions of years old. The author of this article (Dr. Philip J. Senter), however, is confident that this is not a problem at all. How can he be so confident? Because he seems to believe a lot of false information.

Early on, he makes a statement that indicates he has not studied carbon-14 dating very seriously:

…bone mineral is usually useless for radiocarbon dating, even though the carbonate that bone mineral incorporates during life contains 14C. The uselessness of bone mineral for radiocarbon dating is due to the fact that bone mineral accumulates new 14C after death, yielding a falsely young radiocarbon “age.”

This statement is utterly false, and anyone who knows carbon-14 dating would know that. Hundreds of radiocarbon dates have been published in the scientific literature using bioapatite, a bone mineral. This study examined using bioapatite in carbon-14 dating extensively, comparing it to two other commonly-used substances in carbon-14 dating. It concluded:

Most Holocene samples exhibit reliable 14C ages on the bioapatite fraction. Late Pleistocene samples have shown reliable results even for extremely poorly preserved bone in the case of samples derived from a non-carbonate environment.

The Holocene supposedly dates back to about 11,700 years, while the Pleistocene supposedly goes back to 2.6 million years. “Late Pleistocene” samples, then, would be samples that go back to the limits of carbon-14 dating (about 50,000 years old). Indeed, in that study, one of the samples had a carbon-14 date of 37,000 years old, which is older than most of the dinosaur bones that have been dated with carbon-14. So the idea that minerals from bone are “useless” for carbon-14 dating is demonstrably false.

Dr. Senter tries to back up his statement with a reference, but the reference doesn’t invalidate the use of bioapatite in carbon-14 dating at all. It does indicate that when you compare the date derived from collagen (a non-mineral that is often used in carbon-14 dating) to the date derived from bioapatite, the bioapatite date is often younger. However, the results depend heavily on where the fossil was found. More importantly, we know this has nothing to do with the carbon-14 dates of dinosaur bones, since many dinosaur fossils have been dated using both mineral and non-mineral samples (including collagen), and the ages are similar. In a hadrosaur fossil, for example, bioapatite dated as 25,670 years old, while the collagen dated as 23,170 years old. Note that contrary to the study Senter cites, in this case, the bioapatite age is older than the collagen age.

Senter then tries to explain why dinosaur bones read so young with carbon-14 dating. Most of his argument boil down to the idea that modern carbon has gotten into the fossils, and since the modern carbon is very young, it makes the fossil read young. The problem with that, of course, is that if modern carbon is getting into the fossil from the environment, there must be more contamination near the surface of the fossil and less near the center of the fossil. Thus, the carbon-14 age of the bone should vary depending on where in the bone the sample was taken. However, that’s not what is seen. In this study, Figure 7 has circles around the dates for samples taken from different parts of the same bone. They show very good agreement, indicating that what is being detected is not from contamination.

There is one argument Dr. Senter makes which isn’t about contamination. He says that radioactive materials can be absorbed by a bone, and those radioactive materials can cause nuclear reactions which will add carbon-14 to the bone, making it look young. Once again, he cites studies to support his claim, such as this one, but once again, the studies don’t support his claim. For example, the study I just linked shows how uranium decay can lead to the production of carbon-14, but as anyone who understands nuclear reactions would tell you, the effect is ridiculously small. Indeed, the study shows that nuclear reactions can account for no more than one hundreth (1/100) of the lowest amount of carbon-14 detected in dinosaur bones! Thus, there is no way that nuclear reactions are a viable means of explaining around the carbon-14 found in dinosaur bones.

In the end, then, we see that Dr. Senter must use false information to assure his readers that carbon-14 in dinosaur bones doesn’t invalidate the dogma that they are millions of years old. Unfortunately, since many teachers read the magazine in which his article was published, I am sure that this false information will be spread around, fooling unsuspecting students. Nevertheless, the more this is investigated, the more we will see that it poses a huge problem for those who are committed to believing that dinosaurs lived millions of years ago.

Radioactive Honey

In some regions, the honey is more radioactive than it should be. (click for credit)
Radioactivity is everywhere. You can’t get away from it. Even the foods you eat are radioactive, since the molecules in your food have chains of carbon atoms in them, and some of those carbon atoms are radioactive. However, one of the most radioactive foods is the lowly banana. It contains a lot of potassium, and about 0.01% of that potassium is radioactive, spewing beta particles and gamma rays into the surroundings. In fact, there is an informal radiation unit called the banana equivalent dose, which allows you to get an idea of how dangerous common forms of radiation are. A dental X-ray, for example, gives you about as much radiation as 2.5 bananas, while flying across country exposes you to about 400 bananas’ worth of radiation.

The radiation in a banana is natural, and because your body contains the same atoms as the foods you eat, you are naturally radioactive as well. Of course, technology has increased the amount of radiation in food and people, and sometimes, that increased radiation can be traced to specific events. For example, scientists from the College of William & Mary as well as the University of Maryland have studied the radioactive content of honey in the United States. They have found that it is surprisingly rich in radioactive cesium, which is not natural. It is produced by nuclear weapons and the tests associated with them. Plants require potassium to live, but cesium and potassium have similar chemical properties (anyone who has taken my chemistry course should know why), so plants can take up and use cesium instead, including the radioactive cesium made by an atomic bomb.

The researchers found that while there were no atomic bombs exploded in or around the eastern United States, the honey found there has detectable amounts of radioactive cesium. More importantly, there is a definite pattern to how much is found. There is significantly more radiation found in honey made in the southeastern United States, particularly Florida. In fact, the honey found in Florida can be as much as 500 times more radioactive than the honey found farther north. Now that sounds scary, but in fact, even the most radioactive honey they analyzed had only 18% as much radiation as a banana. Thus, it poses no threat to people who eat it, but we don’t know if it affects the bees that make and eat it. However, it does tell scientists that the radioactive materials released in nuclear explosions are not dispersed evenly throughout the world. Instead, weather patterns tend to concentrate them in specific regions.

The other thing the researchers show is that the more potassium found naturally in the soil, the less radioactive cesium found in the honey. Thus, even in Florida, honey from regions where the soil had a high potassium content was less radioactive than honey from regions where the potassium content was lower. As a result, if you want less radiation in your honey, you need to make sure the flowers from which it is made are grown in soil that is rich in potassium.

Total U.S. Deaths Over The Past 7 Years and COVID-19

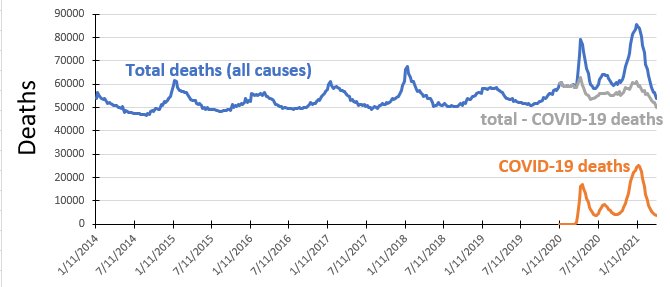
Over the past few weeks, I have gotten some emails regarding COVID-19 that were filled with misinformation. In an attempt to clear up this misinformation, I thought I would look at some data that are rather easy to obtain and analyze: total deaths in the U.S. over the past seven years and the deaths attributed to COVID-19. They come from the CDC, which I know many of my readers don’t trust. Indeed, I don’t trust the CDC when it comes to many of their recommendations, including some related to COVID-19. Nevertheless, these data are rather hard to manipulate, since they come from many independent sources. Thus, while they might not be 100% accurate, the overall conclusions we can draw from them should be reliable.

Looking at the above graph, then, what do we see? Let’s start with the total deaths (in blue). They follow a familiar pattern in the five years leading up to 2020. They peak in January, trail off in the summer, and start rising again in autumn. The peaks are generally attributed to two things: cold weather is more deadly than warm weather, and the influenza season typically peaks in January/February. Indeed, if you look at the heights of the peaks in the years before 2020, you can see when the more severe influenza seasons were: 2015 and 2018.

Notice, however, that 2020 and 2021 break the pattern established in the previous years. The peak in 2020 is much, much higher than the peaks in the previous years, and it comes later in the year (mid-April). In addition, when it comes back down to its minimum (late June), it is much, much higher than the minimum of any other year. Then, there is a bump that occurs later in the year, followed by another peak that is even higher than the one in April of 2020. Clearly, this tells us something unusual happened in 2020, and it is still happening in 2021.

Of course, we know what that unusual situation is: COVID-19. If we graph just the deaths attributed to COVID-19 (in orange), you see the same unusual pattern: a peak that occurs in April of 2020, another bump, and then an even larger peak. Just to see how much of this unusual pattern can be attributed to the COVID-19 deaths, the gray line shows you what happens when you take the total deaths and subtract the COVID-19 deaths. The result is something that looks a lot more like the pattern that was established in the past seven years. However, the pattern isn’t exactly the same as what is seen in the previous years. Notice that the gray line never gets as low as the blue line does in 2014-2019. Thus, even after subtracting out the COVID-19 deaths, there are still more deaths than in the previous years.

What does all this mean? Well, let’s start with two things we can say for certain. First, contrary to what you may have heard (and what I was sent in email), COVID-19 is NOT just a severe flu-like disease. It is responsible for more deaths than any flu in the past seven years. Indeed, the only influenza that was more deadly than COVID-19 in the U.S. (as of right now, anyway) was the 1918 Spanish flu. Second, COVID-19 deaths are not being significantly over-reported. If that were the case, subtracting out the COVID-19 deaths would have resulted in fewer deaths than in previous years (the gray line would have dipped lower than the blue line dips in previous years).

What can we say about the fact that even after subtracting out the COVID-19 deaths, there are still more deaths in 2020 and 2021 than the previous years? As I see it, there are two possibilities. It’s possible that COVID-19 deaths are being under-reported. It’s also possible that the COVID-19 measures that have been instituted have produced some deaths as well. I think the second option is more likely. Social isolation, delaying doctor appointments, etc., will result in more deaths. However, the number of those deaths is small compared to the COVID-19 deaths.

There is one more thing that I see in the data, but it is preliminary at best. Notice that the peak occurred much sooner this year than last. While the peak number of deaths in 2020 occurred in April, this year’s peak occurred in January. Assuming the virus hasn’t changed substantially over the past year, that means something happened to curtail COVID-19 deaths. What happened between 2020 and 2021? The vaccine started rolling out. The first doses were given in December of 2020, and the initial focus was on health care providers and those who are most at risk of dying from COVID-19. To me, it isn’t surprising that this produced enough of a slowdown in COVID-19 to cut the peak back three months. Once again, that is a preliminary conclusion which could be wrong. However, I do think that time will bear it out to be true. Regardless, I will post a similar analysis in a few months to see what the data say then.

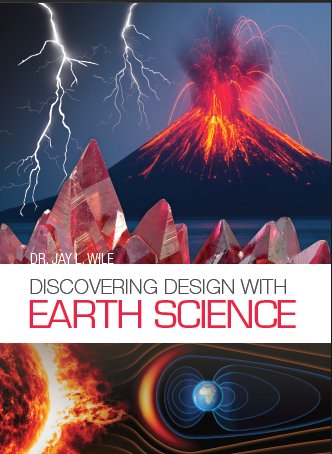
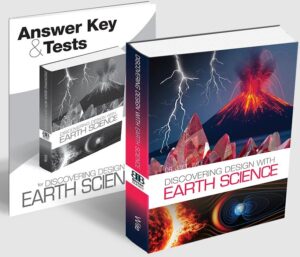
Discovering Design With Earth Science

My latest book has been sent to the printer, and it should be ready in June. To learn more about it, you can go to my publisher’s website. In addition to the course description, you can click on “Product Resources” to get the table of contents, the entire first chapter, a list of the experiment supplies, an overview of the experiments, and a scope and sequence for the course. You can also get on the waiting list so that you are notified as soon as it is ready.

I have already posted a couple of excerpts from the book, but I thought I would give you one more. This comes from the introduction:

You have lived on the earth all your life, but you probably don’t know very much about it. As a child, you probably enjoyed digging in the dirt. But what is dirt? How is it different from rocks? How are rocks different from fossils and gems, which are usually found in rocks? You have sometimes enjoyed the weather and sometimes complained about it. But what makes the different kinds of weather you have experienced? You generally get up after the sun rises, and you have probably gazed at the stars after the sun has set. But what makes the sun rise and set? What are the stars? You will find the answers to these questions through a study of earth science, which is what I will cover in this book.

The earth is a marvel of design and complexity, because God made it. Psalm 24:1 tells us, “The earth is the Lord’s, and all it contains, The world, and those who dwell in it.” Psalm 111:2 also tells us, “Great are the works of the Lord; They are studied by all who delight in them.” I am sure that there have been times you have been delighted by the earth. I know that every time I sit on a beach or scuba dive in the ocean, I am delighted. The same thing happens when I gaze at a beautiful mountain or see constellations of stars in the night sky. Because I have been so delighted by the earth, I want to study it. I hope that this course makes you take even more delight in this planet that you call home, and I hope that it encourages you to continue studying the earth, even once you are finished with this book.

Why Do Creationists Use the Bible for Science?

Matthew Fontaine Maury, who was inspired by the Bible to map ocean currents.
This blog has been more quiet than usual, because I am trying to put the finishing touches on my new book, Discovering Design with Earth Science. As soon as that job is complete, you will be able to see preview materials at my publisher’s website. I decided to pause for a moment, however, because I was recently asked the following question by a frustrated atheist:

Why would you even think of using the Bible for science? It isn’t a scientific book!

It turns out that Discovering Design with Earth Science has two answers to that question. I shared them with him, and I thought I would share them with you as well. In the book, I present both sides of the age-of-the-earth issue in as unbiased a way as possible. I start with the uniformitarian view, which requires a very old earth. I then present the young-earth creationist view. The first answer to the atheist’s question is found at the beginning of that discussion:

Suppose you are examining the ruins of an ancient city and want to learn as much as you can about when it was built, how it was built, and how it fell into ruin. You see some of the remains of buildings, streets, walls, etc., but nothing has been preserved intact. You can learn a lot by investigating the ruins, but your conclusions will be based on your interpretation of what you see. Now suppose you found out that there was a book written shortly after the city was built, and it discusses the politics of the city for several centuries. While the focus of the book is on the government, it does cover many aspects of how and when the city was built.

Would you completely ignore the book and just examine the ruins, relying on your own interpretation to determine the city’s history? Of course not! If you wanted to learn the truth about the city’s history, you would read the book and let it help you interpret the ruins that you are investigating. This is how young-earth-creationists (YECs) study the geological record. They believe they have a book (the Bible) that comes from the Creator Himself. While the book focuses on more important things like salvation, morality, and our duties to God, it does discuss the creation of the universe, the earth, the organisms that lived on earth, etc. Since YECs consider the Bible to be an accurate source of history, they use it as a guide to studying the “ruins” of the geological column and fossil record. There’s a lot more to the history of the earth than what is in the Bible, but at least the Bible gives YECs a starting point to help their interpretation of the geological record.

The second answer to the atheist’s question comes from my discussion of the surface currents found in the ocean. While others had mapped some of those currents (Ben Franklin, for example, mapped the Gulf Stream), the man most responsible for mapping the ocean’s surface currents was Matthew Fontaine Maury, who is pictured above. He was inspired to search for the “paths of the seas” that are mentioned in Psalm 8:8, and after an exhaustive research effort, he ended up producing a detailed map of those currents. This revolutionized ocean travel, so he became quite famous in his time. He ended up writing a very important text on oceanography (what they called “physical geography” back then): The Physical Geography of the Sea. In that book, he references the Bible several times. In my earth science book, I tell the students all of this and then I add:

Many scientists didn’t like that and tried to discourage him from connecting the Bible to science. In a speech given at the founding of The University of the South, he gave those scientists a stern rebuke:

I have been blamed by men of science, both in this country and in England, for quoting the Bible in confirmation of the doctrines of physical geography. The Bible, they say, was not written for scientific purposes, and is therefore of no authority in matters of science. I beg pardon! The Bible is authority for everything it touches.
(Diana Fontaine Corbin, A Life of Matthew Fontaine Maury, Samson, Lowe, et. al., 1888, p. 192)

Young-earth creationists like me really believe that. The Bible is an authority when it comes to all the important things of life: salvation, morality, our duties to God, etc. However, because it was written by the Creator Himself, we believe it is an authority in whatever it mentions, including science.

A Monkey/Man Embryo

An illustration from the scientific paper being discussed.
A few readers have sent me news stories like this one, entitled “Human-Monkey Hybrid Embryo Created by Joint China-U.S. Scientist Team.” Obviously, the concept of mixing the embryos of people and animals is abhorrent, so these readers wanted my view on the experiment and what it means. Since “science journalists” know little about science and even less about journalism, I ignored what has been written in the press and went straight to the actual scientific paper to find out what had been done. While the paper alleviated some of my initial concerns, it most certainly didn’t alleviate all of them.

What did the researchers actually do? They first developed a method for fertilizing the eggs of a long-tailed macaque (Macaca fasciularis) so that the monkey embryo could start development in a lab dish instead of the body of a female macaque. Once they accomplished that, they took human pluripotent stem cells (hPSCs) that had already been developed and injected them into the lab-dish monkey embryos once they reached a specific stage in development, called the “blastocyst stage.” They then followed the development of these mixed embryos over time.

Why would someone want to do something like this? The scientists on the project were mostly interested in trying to understand how the cells in an embryo communicate with one another so that they can do the jobs they need to do to make a baby. They thought that if they could see how the human cells communicated with one another in this kind of system, it would help them understand human embryonic development better. Of course, to “sell” the research, they also indicated that it could help produce animals that could grow human organs for transplant, since many people die waiting for an organ transplant.

Were they successful? Not really, but they were able to get some results. They started with 132 separate monkey embryos, and they injected 25 human stem cells into each of them once they reached the blastocyst stage. Stem cells have the ability to develop into many different kinds of cells, so they hoped that human cells would communicate with one another and mimic what happens during early human embryonic development. However, over the course of 20 days, most of the embryos died. Only three of them survived for 19 days, and there was significant interaction between the human and monkey cells. As a result, it’s not clear how much of what happened to the human cells is related to actual human embryonic development.

Now remember, I said the paper alleviated some of my concerns. That’s because the source of the human cells is not immoral. There are three ways to get human stem cells. The first way is to extract them from a human embryo. This kills the baby, so murders must be committed in order to use such cells. Thus, no one with any sense of morality should be involved in such research. Fortunately, this experiment didn’t use such cells.

The second way to get human stem cells is to harvest them from the umbilical cord after birth or from certain parts of an adult. This doesn’t kill anyone, so there is nothing unethical about their use. Indeed, several successful medical treatments are based on such cells, which are usually called “adult stem cells.” This experiment didn’t use those cells, either. Instead, it used mature cells (from an adult) that had been chemically reprogrammed to act like stem cells. Such cells are usually called “induced pluripotent stem cells,” and once again, no one is killed in the process. Thus, at least the source of human stem cells used in the experiment is a moral one.

However, my concerns are not fully alleviated. After all, this experiment could be done by others who are immoral enough to use stem cells that require babies to be murdered. Indeed, there are probably scientists reading this very paper thinking that one reason the survival rate was so low was because the stem cells did not come from a human embryo. As a result, they might try to replicate this experiment with immorally-sourced stem cells.

Of course, the other serious issue is that this experiment could be altered so that the mixed embryo is implanted back into a female monkey, in hopes that some kind of creature would actually be born. I seriously doubt such a thing could actually happen, because embryonic development is so complex that the communication between monkey and human cells would eventually cause the process to break down. Nevertheless, the possibility exists that such a monster could be produced, which is morally repugnant.

Now I do have to say that the authors of the study went to great pains to make sure that their experiment was deemed “ethical.” However, that doesn’t comfort me in the slightest. After all, the medical community thinks abortion is ethical, and it is clearly not. Given this fact, I don’t think this line of research should be extended. There are just too many ways it could be done immorally, and the medical community has shown that its sense of morality is, at best, stunted.