Well, a reader let me know that Senter had replied to my article (scroll down a bit to get to his reply). Not surprisingly, it is filled with many more false statements. For example, in his original article, he claimed that bone mineral (which is often used to find carbon-14 in dinosaur fossils) is more easily contaminated than the organic remains, like collagen, so bone mineral should never be used. In fact, he stated, “bone mineral is usually useless for radiocarbon dating.”
When I showed how egregiously false that statement is, he decided to backpedal. In his reply, he now claims:
“Fossil bone mineral (i.e., bone mineral older than 10,000 years old) is usually useless for radiocarbon dating.”
Of course, this is also a completely false statement, as anyone with a cursory knowledge of the relevant literature should know. In this article, for example, the researchers indicate that the collagen in their whale fossil (which they think is more than 30,000 years old) was not useful for carbon dating, so they used the date from bone mineral (bioapatite). They claim:
Because the dates obtained were so disparate relative to the age for the sediment outcrop/coquina – this is to say the bones were younger than the deposit – it was decided to date all elements using bioapatite, which is better preserved in bone that has undergone a long period of immersion in the marine environment. The range of AMS-RC ages (Table 1) for the bioapatite portion of the bones are consistent with the burial sediment ages of 32-44,000 YBP obtained using AMS, OSL, U-Th and AAR ages for sediment and wood/shell inclusions (Garrison et al., 2008, table 3).
This is common in the literature. In some cases, bone minerals are considered better preserved than collagen, so they are considered the better source for radiocarbon dates, even for fossils that are supposed to be well over 10,000 years old.
In my original article, I used this reference, to show that bone minerals in fossils give a very similar carbon-14 age as the collagen in the fossil. Senter’s second claim is that the research is bad because even the collagen is contaminated with more recent carbon. However, the same author later published another paper comparing collagen and bone mineral carbon-14 dates for fossils that were supposed to be between 17,000 and 40,000 years old. Once again, the dates were very similar. Yes, the bone mineral dates were systematically lower, but only by 13-23%. In the end, that kind of error cannot accomplish what Senter needs it to accomplish: causing a bone that is supposed to be millions of years old to read as only tens of thousands of years old. More importantly, if the first paper is so wrong (as Senter contends), how did this second paper (which uses essentially the same technique) make it past peer review? The fact is, we know that bone minerals and collagen often yield very similar carbon-14 dates.
This relates to Senter’s third claim, which is also false. He says that an article he originally referenced shows that bone mineral consistently dates younger than collagen does. In his reply, he claims that I say the article doesn’t show this. I didn’t say that at all. I simply correctly pointed out that this isn’t always the case, and cited a study that shows in some cases (including the first study I linked above), the bone mineral dates are older.
Senter’s next false claim also shows he is unfamiliar with the literature. In my original reply, I wrote that many fossils have been carbon-14 dated using both the collagen and bone minerals, and in general, the results are similar. I used this reference to support my correct statement. In Senter’s reply, he claims:
The reference that Wile cites (Miller et al. 2019) is currently the only study in which the “collagen fraction” of dinosaur bone has been separated from the mineral fraction and subjected to radiocarbon dating.
He then attempts to cast doubt on the study. Of course, anyone with a cursory knowledge of the literature would know that the Miller et al. study is far from the only one that compares radiocarbon dates in collagen and bone material for fossils that are supposedly older than 10,000 years (Senter’s new age limit for using bone minerals). Indeed, I have already given two other references in this article that do exactly the same thing, and both of them predate Senter’s reply! They don’t use dinosaur bones, but they give ages that are on the same order as those in the Miller et. al. report. I do hope that more studies are done specifically on dinosaur bones, but the point is that whether or not one uses bone minerals or collagen, there are significant amounts of carbon-14 in dinosaur fossils.
Senter’s fifth claim is also false. In my original reply, I said that the exterior of the bone should be subject to more carbon-14 contamination than the interior, and Miller’s study shows that there is more carbon-14 inside the bone than outside. He claims that, based on his experience, fossil bones are often cracked, so the interior is just as exposed as the exterior. Yes, fossils are often cracked, and that makes the interior more vulnerable to contamination than if it weren’t cracked, but it is still not more vulnerable than the exterior! After all, a crack has less surface area than the entire surface of the bone! Thus, if the detected carbon-14 were the result of contamination, there should still be a decrease from exterior to interior, and the data show no such decrease.
While not explicitly false, Senter’s sixth statement is dubious at best. He originally claimed that uranium in fossils could turn carbon-13 and carbon-12 into carbon-14, causing the fossil to read abnormally young. I cited a study that showed such reactions produce an infinitesimal amount of carbon-14 and cannot explain the large amounts of carbon-14 found in dinosaur bones. Senter now claims that this study is for oil fields, which have a lower amount of uranium contamination than that of many fossils. Thus, the effect for fossils should be higher. However, he cannot support that with a study, because there have been no studies done on this. Based on my experience with nuclear reactions, there is no way uranium contamination can produce enough carbon-14 to explain what is found in dinosaur bones. Without a study to indicate otherwise, I see this as a highly dubious argument.
Senter’s seventh claim is that all his statements come from the references he gave, so if I am arguing with him, I am arguing with his references. This, of course, is also false. As I showed in my original article and in this one, Senter either makes false statements about his references or is unaware of other references that contradict the ones he gives. I am using the whole of the scientific literature on this topic to show that he is wrong.
Senter’s closing thoughts say that he is a Christian but doesn’t have a problem with an ancient earth. I think he assumes that I am a young-earth creationist solely because of my views on the Bible. Once again, however, that is utterly false. I have said many times on this blog that I have no theological problem with an old earth (here, here, and here, for example). However, being both a scientist and a Christian allows me to be open-minded on the age of the earth, because God could have created over billions of years or 6 solar days. Thus, I can look at the data objectively, and an objective look at the data leads me to believe that the earth is young.
Unfortunately, it seems that Dr. Senter is the one who is dogmatically committed to a specific age of the earth. In his reply, he says:
…God’s revelation through nature (as a scientist who is a Christian might call it) unequivocally reveals that the earth is billions of years old and that the bodies of all organisms evolved over billions of years from that of a single-celled common ancestor.
Since he has this dogmatic view, it is not surprising that he must attempt to explain away the carbon-14 found in dinosaur fossils. Since my view is less dogma-driven, I can evaluate the data without feeling the need to explain it away. Now of course, Dr. Senter has every right to cling to his dogma. Who knows? The dogma might even be right. I just wish he wouldn’t continue to promulgate misinformation in his fervent desire to follow it.
NOTE: Based on an email, I reworked the discussion of the Miller et. al. study to make my point more clear.
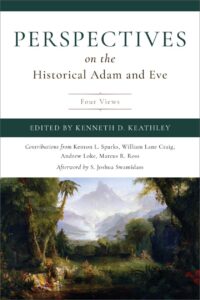 In my opinion, one of the best ways to think deeply about an issue is to read about it from different points of view. Generally, I have to do that by reading many books by different authors on the same topic. In that situation, however, I don’t get to experience any interaction between the authors. That’s what makes a book like
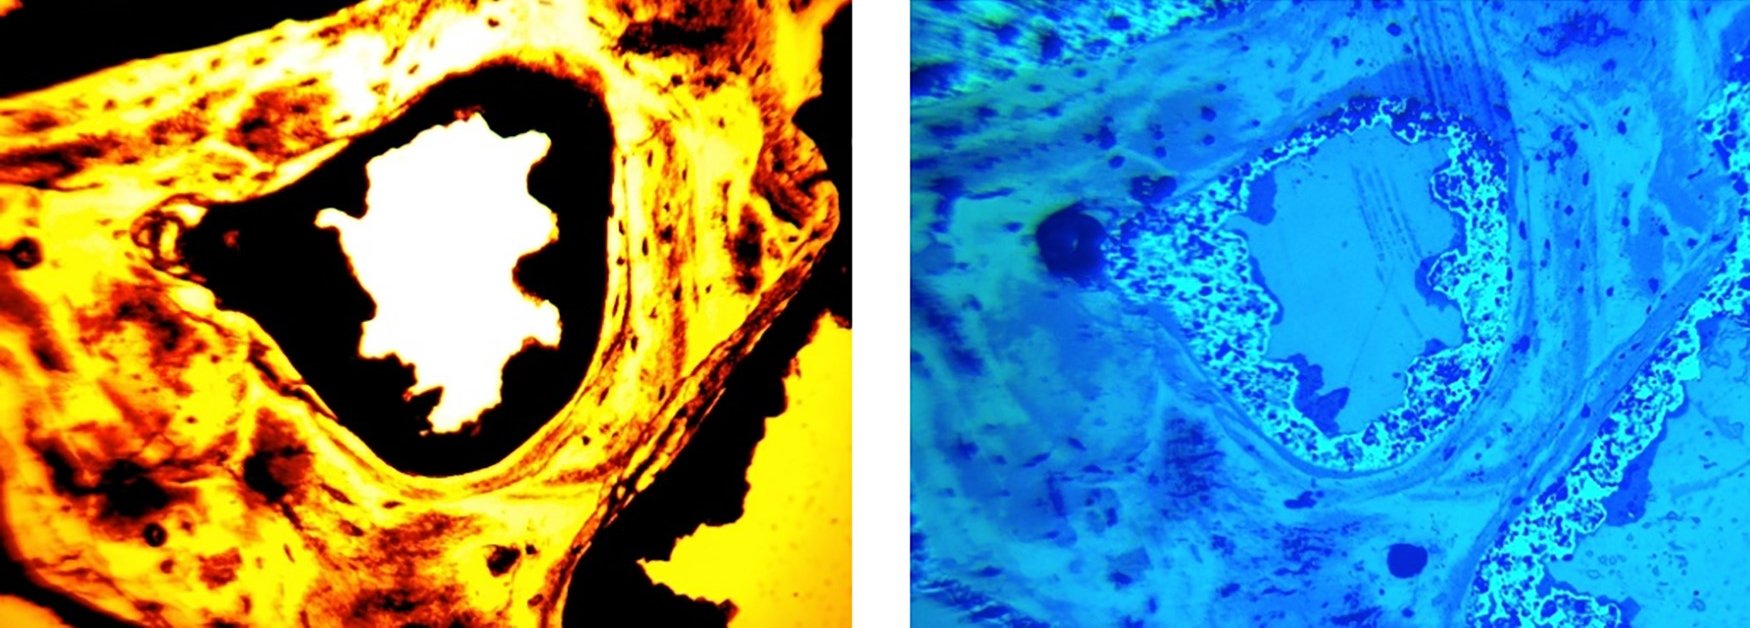
,_Semliki_Wildlife_Reserve.jpg)